
Page 121 - EJMO-9-2
P. 121
Eurasian Journal of
Medicine and Oncology Understanding ulcerative colitis
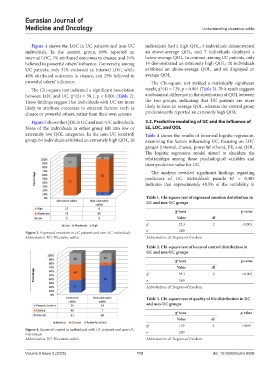
Figure 4 shows the LOC in UC patients and non-UC individuals had a high QOL, 9 individuals demonstrated
individuals. In the control group, 69% reported an an above-average QOL, and 7 individuals displayed a
internal LOC, 7% attributed outcomes to chance, and 24% below-average QOL. In contrast, among UC patients, only
believed in powerful others’ influence. Conversely, among 14 demonstrated an extremely high QOL; 20 individuals
UC patients, only 31% endorsed an internal LOC, while exhibited an above-average QOL, and 66 displayed an
40% attributed outcomes to chance, and 29% believed in average QOL.
powerful others’ influence. The Chi-square test yielded a statistically significant
2
The Chi-square test indicated a significant association result, χ (4) = 129, p < 0.001 (Table 3). This result suggests
between LOC and UC, χ (2) = 38.1, p < 0.001 (Table 2). a substantial difference in the distribution of QOL between
2
These findings suggest that individuals with UC are more the two groups, indicating that UC patients are more
likely to attribute outcomes to external factors, such as likely to have an average QOL, whereas the control group
chance or powerful others, rather than their own actions. predominantly reported an extremely high QOL.
Figure 5 shows the QOL in UC and non-UC individuals. 3.2. Predictive modeling of UC and the influence of
None of the individuals in either group fell into low or EE, LOC, and QOL
extremely low QOL categories. In the non-UC (control) Table 4 shows the results of binomial logistic regression,
group, 64 individuals exhibited an extremely high QOL, 20 examining the factors influencing UC, focusing on LOC
groups (internal, chance, powerful others), EE, and QOL.
The logistic regression model aimed to elucidate the
relationships among these psychological variables and
their predictive value for UC.
The analysis revealed significant findings regarding
predictors of UC. McFadden’s pseudo R = 0.485
2
indicates that approximately 48.5% of the variability in
Table 1. Chi‑square test of expressed emotion distribution in
UC and non‑UC groups
χ tests p‑value
2
Value df
χ 2 23.3 2 <0.001
Figure 3. Expressed emotions in UC patients and non-UC individuals n 200
Abbreviation: UC: Ulcerative colitis. Abbreviation: df: Degrees of freedom.
Table 2. Chi‑square test of locus of control distribution in
UC and non‑UC groups
χ tests p‑value
2
Value df
χ 2 38.1 2 <0.001
n 200
Abbreviation: df: Degrees of freedom.
Table 3. Chi‑square test of quality of life distribution in UC
and non‑UC groups
χ tests p‑value
2
Value df
χ 2 129 4 <0.001
Figure 4. Locus of control in individuals with UC patients and non-UC
individuals n 200
Abbreviation: UC: Ulcerative colitis. Abbreviation: df: Degrees of freedom.
Volume 9 Issue 2 (2025) 113 doi: 10.36922/ejmo.8596