
Page 122 - EJMO-9-2
P. 122
Eurasian Journal of
Medicine and Oncology Understanding ulcerative colitis
QOL exhibited a negative association (Estimate: −0.150,
SE: 0.0234, Z: −6.417, p < 0.001), suggesting that higher
QOL is associated with reduced odds of UC. LOC groups
“powerful others” – internal and chance – Internal showed
intriguing trends. While “powerful others” – internal had a
positive coefficient, it did not reach statistical significance
at the 0.05 level (Estimate: 0.793, SE: 0.4815, Z: 1.647,
p = 0.100). Similarly, chance – internal was not a significant
predictor of UC odds (Estimate: 0.362, SE: 0.6787, Z: 0.534,
p = 0.594).
The classification table, using a cut-off value of 0.5,
demonstrated an overall accuracy of 82.5%, with high
sensitivity (84.0%) and specificity (81.0%). These results
highlight the model’s efficacy in accurately classifying
individuals with and without UC (Table 1). In summary,
this analysis not only emphasizes the statistical significance
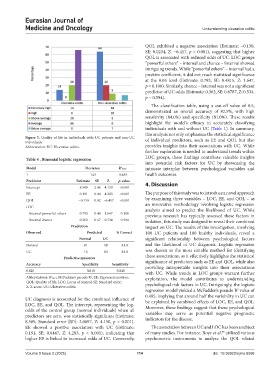
Figure 5. Quality of life in individuals with UC patients and non-UC of individual predictors, such as EE and QOL but also
individuals
Abbreviation: UC: Ulcerative colitis. provides insights into their associations with UC. While
further exploration is needed to understand trends within
Table 4 . Binomial logistic regression LOC groups, these findings contribute valuable insights
into potential risk factors for UC by showcasing the
Model Deviance R MCF intricate interplay between psychological variables and
2
1 143 0.485 health outcomes.
Predictor Estimate SE Z p‑value 4. Discussion
Intercept 8.589 2.06 4.150 <0.001
EE 0.191 0.04 4.283 <0.001 The purpose of this study was to introduce a novel approach
by examining three variables – LOC, EE, and QOL – as
QOL −0.150 0.02 −6.417 <0.001
LOC an innovative methodology involving logistic regression
analysis aimed to predict the likelihood of UC. While
Internal-powerful others 0.793 0.48 1.647 0.100 previous research has typically assessed these factors in
Internal chance 0.362 0.67 0.534 0.594 isolation, this study was designed to reveal their combined
Prediction impact on UC. The results of this investigation, involving
Observed Predicted % Correct 100 UC patients and 100 healthy individuals, reveal a
Normal UC significant relationship between psychological factors
Normal 81 19 81.0 and the likelihood of UC diagnosis. Logistic regression
UC 16 84 84.0 was chosen as the most suitable method for identifying
Predictive measures these associations, as it effectively highlights the statistical
Accuracy Specificity Sensitivity significance of predictors such as EE and QOL, while also
providing interpretable insights into their associations
0.825 0.810 0.840 with UC. While trends in LOC groups warrant further
Abbreviations: R MCF: McFadden’s pseudo R , EE: Expressed emotion; exploration, the model contributes to understanding
2
2
QOL: Quality of life; LOC: Locus of control; SE: Standard error; psychological risk factors in UC. Intriguingly, the logistic
Z: Z-score, UC: Ulcerative colitis.
regression model yielded a McFadden’s pseudo R value of
2
0.485, implying that around half the variability in UC can
UC diagnosis is accounted for the combined influence of be explained by combined effects of LOC, EE, and QOL.
LOC, EE, and QOL. The intercept, representing the log- Moreover, these findings suggest that these psychological
odds of the control group (normal individuals) when all variables may serve as potential negative prognostic
predictors are zero, was statistically significant (Estimate: indicators for the disease.
8.589, Standard error [SE]: 2.0697, Z: 4.150, p < 0.001).
EE showed a positive association with UC (Estimate: The association between UC and LOC has been a subject
0.191, SE: 0.0447, Z: 4.283, p < 0.001), indicating that of many studies. For instance, Boye et al. utilized various
35
higher EE is linked to increased odds of UC. Conversely, psychometric instruments to analyze the QOL related
Volume 9 Issue 2 (2025) 114 doi: 10.36922/ejmo.8596