
Page 134 - EJMO-9-3
P. 134
Eurasian Journal of
Medicine and Oncology KRAS TP53 cholangiocarcinoma
All 12 studies reported survival curves that allowed for wild-type groups (Z=8.39 and p<0.0001). Further, Begg’s
the examination of the relationship between KRAS and TP53 test indicated no publication bias (p=0.1286), whereas
mutations and survival outcomes in cholangiocarcinoma. Egger’s test indicated (p<0.05). Therefore, we performed a
The survival curves were essential for understanding how trim-and-fill analysis, and the results are shown in Figure 3.
these mutations influence patient prognosis. Among the The trim-and-fill method, a classic adjustment technique
included studies, five provided 95% CIs necessary for for publication bias, corrects for the asymmetry in the
calculating HRs. The remaining studies provided sufficient effect size distribution using an iterative trimming process.
data, including survival time and event data, to calculate This procedure involves two stages: (1) the trimming stage
HRs and 95% CIs. The specific characteristics of each of the (trim), where extreme effect size observations (often due to
12 included studies are summarized in Table 1, outlining small-study effects or selective publication) are identified
study designs, patient demographics, treatment regimens, and excluded using non-parametric iterative algorithms;
and key findings related to the impact of KRAS and TP53 and (2) the filling stage (fill), where missing studies are
mutations on survival outcomes. In addition, Figure 1 simulated and added to restore symmetry in the funnel
illustrates the study flow, illustrating the steps of the plot. In this study, we applied the trim-and-fill method
systematic review process from the initial database search using the R software, and the results showed that after
to the final inclusion of studies. This visual representation adjustment, one potentially missing study was identified
enhances transparency and provides clarity regarding the (k*=1), increasing the total number of studies to 11
selection and inclusion criteria applied in the meta-analysis. (kadj=11). As shown in Figure 3, after the adjustment, the
analysis indicated a highly significant relationship between
3.2. Meta-analysis findings KRAS mutation and survival differences, with a statistically
This meta-analysis ultimately included 12 relevant significant effect estimate of 12.84 units (p<0.0001; 95% CI:
cholangiocarcinoma studies. Among them, 10 studies 9.01 – 16.670). These results suggest that KRAS mutations
described the relationship between KRAS gene status and play an important role in the survival prognosis of
patient survival, and five studies described the relationship cholangiocarcinoma patients.
between TP53 gene status and patient survival. Our When the TP53 gene status in cholangiocarcinoma
results indicate that patients with KRAS mutations have prognosis was evaluated, our analysis showed that patients with
a poorer prognosis compared to those without mutations TP53 mutations have a poorer prognosis compared to those
(HR=7.26; 95% CI: 6.10 – 9.81; p<0.05), and no significant without mutations (HR=20.03; 95% CI: 6.79 – 33.28; p<0.05).
heterogeneity was found among the studies (fixed-effects The analysis showed some heterogeneity (fixed-effects model:
model; I =48%). The forest plot related to the KRAS study I =59%; p<0.05, overall effect 95% CI=11.24 – 25.32; random-
2
2
is shown in Figure 2, with a significant overall effect and effects model: I =59%, p<0.05, overall effect 95% CI: 6.79 –
2
a highly significant difference between KRAS mutant and 33.28). The forest plot for TP53 analysis is shown in Figure 4,
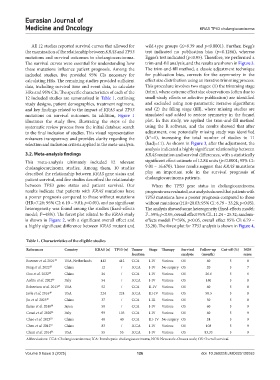
Table 1. Characteristics of the eligible studies
References Country KRAS (n) TP53 (n) Tumor Stage Therapy Survival Follow‑up Cut‑off (%) NOS
location analysis (month) score
Boerner et al. 2021 44 USA, Netherlands 412 412 CCA I-IV Various OS 60 5 8
Peng et al. 2022 25 China 12 / ICCA I-IV No surgery OS 20 5 7
Guo et al. 2022 45 China 26 / CCA I-IV Various OS 26.6 5 6
Ardito et al. 2022 46 Italy 54 / ICCA I-IV Various OS 180 5 8
Robertson et al. 2013 47 USA 52 / CCA II-IV Various OS 60 5 8
Javle et al. 2016 48 USA 224 224 ICCA III-IV Various OS 58.3 5 8
Jin et al. 2023 49 China 37 / CCA I-III Various OS 50 5 8
Ikeno et al. 2018 50 Japan 50 / CCA I-IV Various OS 60 5 9
Conci et al. 2020 51 Italy 99 103 CCA I-IV Various OS 60 5 9
Chao et al. 2023 52 China 40 40 CCA III- IV No surgery OS 24 5 9
Chen et al. 2012 53 China 83 / ICCA I-IV Various OS 108 5 9
Churi et al. 2014 54 USA 55 55 ICCA I-IV Various OS 83.33 5 9
Abbreviations: CCA: Cholangiocarcinoma; ICA: Intrahepatic cholangiocarcinoma; NOS: Newcastle–Ottawa scale; OS: Overall survival.
Volume 9 Issue 3 (2025) 126 doi: 10.36922/EJMO025120063