
Page 17 - ESAM-1-4
P. 17
Engineering Science in
Additive Manufacturing Experimental statistics in AM
A
B
C
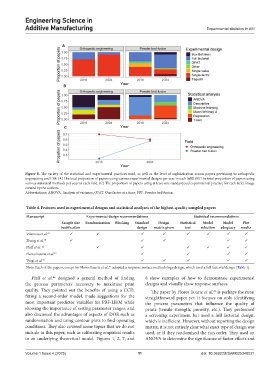
Figure 8. The variety of the statistical and experimental practices used, as well as the level of sophistication across papers pertaining to orthopedic
engineering and PBF. (A) The total proportion of papers using various experimental designs per year in each field. (B) The total proportion of papers using
various statistical methods per year in each field. (C) The proportion of papers using at least one standardized experimental practice for each field. Image
created by the authors.
Abbreviations: ANOVA: Analysis of variance; OFAT: One factor at a time; PBF: Powder bed fusion.
Table 4. Features used in experimental designs and statistical analyses of the highest‑quality sampled papers
Manuscript Experimental design recommendations Statistical recommendations
Sample size Randomization Blocking Standard Design Statistical Model Model Plot
justification design matrix given test selection adequacy results
Vilanova et al. 41
Zhang et al. 18
Pfaff et al. 42
Flores Ituarte et al. 43
Tyagi et al. 44
Note: Each of the papers, except for Flores Ituarte et al., adopted a response surface methodology design, which used a full factorial design [Table 1].
43
Pfaff et al. designed a general method of finding 8 show examples of how to demonstrate experimental
42
the process parameters necessary to maximize print designs and visually show response surfaces.
quality. They pointed out the benefits of using a CCD, The paper by Flores Ituarte et al. is perhaps the most
43
fitting a second-order model, made suggestions for the straightforward paper yet: it focuses on only identifying
most important predictor variables for PBF-LB/M while the process parameters that influence the quality of
showing the importance of setting parameter ranges, and prints (tensile strength, porosity, etc.). They performed
also discussed the advantages of aspects of DOE such as a screening experiment but used a full factorial design,
randomization and using contour plots to find operating which is inefficient. However, without reporting the design
conditions. They also covered some topics that we do not matrix, it is not entirely clear what exact type of design was
include in this paper, such as calibrating empirical results used, or if they randomized the run order. They used an
to an underlying theoretical model. Figures 1, 2, 7, and ANOVA to determine the significance of factor effects and
Volume 1 Issue 4 (2025) 11 doi: 10.36922/ESAM025340021