
Page 14 - ESAM-1-4
P. 14
Engineering Science in
Additive Manufacturing Experimental statistics in AM
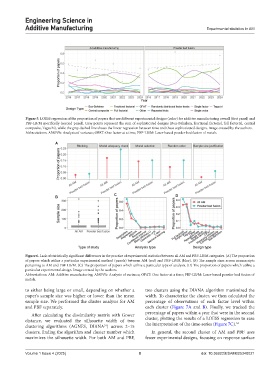
Figure 5. LOESS regression of the proportion of papers that use different experimental designs (color) for additive manufacturing overall (first panel) and
PBF-LB/M specifically (second panel). Gray points represent the sum of sophisticated designs (Box-Behnken, fractional factorial, full factorial, central
composite, Taguchi), while the gray dashed line shows the linear regression between time and these sophisticated designs. Image created by the authors.
Abbreviations: ANOVA: Analysis of variance; OFAT: One factor at a time; PBF-LB/M: Laser-based powder bed fusion of metals.
A
C D
B
Figure 6. Lack of statistically significant differences in the practice of experimental statistics between all AM and PBF-LB/M categories. (A) The proportion
of papers which utilize a particular experimental method (panels) between AM (red) and PBF-LB/M (blue). (B) The sample sizes across manuscripts
pertaining to AM and PBF-LB/M. (C) The proportion of papers which utilize a particular type of analysis. (D) The proportion of papers which utilize a
particular experimental design. Image created by the authors.
Abbreviations: AM: Additive manufacturing; ANOVA: Analysis of variance; OFAT: One factor at a time; PBF-LB/M: Laser-based powder bed fusion of
metals.
to either being large or small, depending on whether a two clusters using the DIANA algorithm maximized the
paper’s sample size was higher or lower than the mean width. To characterize the cluster, we then calculated the
sample size. We performed the cluster analysis for AM percentage of observations of each factor level within
and PBF separately. each cluster (Figure 7A and B). Finally, we tracked the
After calculating the dissimilarity matrix with Gower percentage of papers within a year that were in the second
distance, we evaluated the silhouette width of two cluster, plotting the results of a LOESS regression to ease
32
clustering algorithms (AGNES, DIANA ) across 2–15 the interpretation of the time-series (Figure 7C).
31
clusters, finding the algorithm and cluster number which In general, the second cluster of AM and PBF uses
maximizes the silhouette width. For both AM and PBF, fewer experimental designs, focusing on response surface
Volume 1 Issue 4 (2025) 8 doi: 10.36922/ESAM025340021