
Page 10 - ESAM-1-4
P. 10
Engineering Science in
Additive Manufacturing Experimental statistics in AM
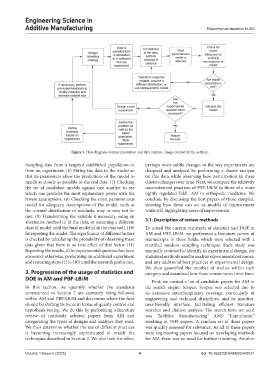
Figure 1. Flow diagram of experimentation and data analysis. Image created by the authors.
Sampling data from a targeted established population or perhaps more subtle changes in the way experiments are
from an experiment. (6) Fitting the data to the model so designed and analyzed by performing a cluster analysis
that its parameters allow the predictions of the model to on this data while observing how participation in these
match as closely as possible to the real data. (7) Checking clusters changes over time. Next, we compare the relatively
the set of candidate models against one another to see unconstrained practices of PBF-LB/M to those of a more
which one provides the most explanatory power with the tightly regulated field—AM in orthopedic medicine. We
fewest assumptions. (8) Checking the most parsimonious conclude by discussing the best papers of those sampled,
model for adequacy. Assumptions of the model, such as showing how these can act as models of improvement
the normal distribution of residuals, may or may not be while still highlighting areas of improvement.
met. (9) Transforming the variable if necessary, using an
alternative method to fit the data, or assuming a different 3.1. Description of review methods
class of model until the final model(s) fit the data well. (10) To unveil the current standards of statistics and DOE in
Interpreting the model. The significance of different factors AM and PBF-LB/M, we performed a literature survey of
is checked by calculating the probability of observing these manuscripts in these fields, which were selected with a
data given that there is no true effect of that factor. (11) stratified random sampling technique. Each study was
Reporting the results, if the experimental question has been manually reviewed to identify its experimental design, the
answered; otherwise, performing an additional experiment statistical methods used to analyze experimental outcomes,
and repeating steps (4) to (10) until the research goal is met. and any additional best practices in experimental design.
We then quantified the number of studies within each
3. Progression of the usage of statistics and category and examined how these counts varied over time.
DOE in AM and PBF-LB/M
First, we created a list of candidate papers for AM in
In this section, we quantify whether the standards the search engine Scopus. Scopus was selected due to
summarized in Section 2 are currently being followed its extensive interdisciplinary coverage, particularly of
within AM and PBF-LB/M and determine where the field engineering and technical disciplines, and its intuitive,
should be shifting its focus in terms of quality control and user-friendly interface, facilitating efficient literature
hypothesis testing. We do this by performing a literature searches and citation analysis. The search term we used
review of randomly selected papers from AM and was “Additive Manufacturing” AND “Experiment,”
categorizing the types of designs and analyses they used. resulting in 5549 papers. A random set of these papers
We then determine whether the use of different practices was quickly assessed for relevance. As all of these papers
is becoming increasingly sophisticated to match the were engineering papers focused on developing methods
techniques described in Section 2. We also look for other, for AM, there was no need for further trimming. Another
Volume 1 Issue 4 (2025) 4 doi: 10.36922/ESAM025340021