
Page 13 - ESAM-1-4
P. 13
Engineering Science in
Additive Manufacturing Experimental statistics in AM
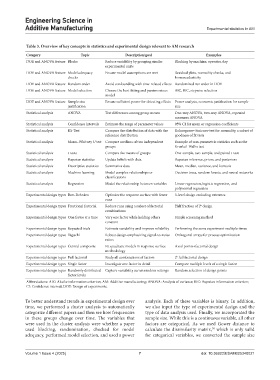
Table 3. Overview of key concepts in statistics and experimental design relevant to AM research
Category Topic Description/goal Examples
DOE and ANOVA feature Blocks Reduce variability by grouping similar Blocking by machine, operator, day
experimental units
DOE and ANOVA feature Model adequacy Ensure model assumptions are met Residual plots, normality checks, and
checks homoscedasticity
DOE and ANOVA feature Random order Avoid confounding with time-related effects Randomized run order in DOE
DOE and ANOVA feature Model selection Choose the best-fitting and parsimonious AIC, BIC, stepwise selection
model
DOE and ANOVA feature Sample size Ensure sufficient power for detecting effects Power analysis, economic justification for sample
justification size
Statistical analysis ANOVA Test differences among group means One-way ANOVA, two-way ANOVA, repeated
measures ANOVA
Statistical analysis Confidence intervals Estimate the range of parameter values 95% CI for mean or regression coefficients
Statistical analysis KS-Test Compare the distribution of data with the Kolmogorov–Smirnov test for normality, a subset of
reference distribution goodness of fit tests
Statistical analysis Mann–Whitney U test Compare medians of two independent Example of non-parametric statistics such as the
groups Kruskal–Wallis test
Statistical analysis t-tests Compare the means of groups One-sample, two-sample, and paired t-test
Statistical analysis Bayesian statistics Update beliefs with data Bayesian inference, priors, and posteriors
Statistical analysis Descriptive statistics Summarize data Mean, median, variance, and kurtosis
Statistical analysis Machine learning Model complex relationships or Decision trees, random forests, and neural networks
classifications
Statistical analysis Regression Model the relationship between variables Linear regression, logistic regression, and
polynomial regression
Experimental design types Box–Behnken Optimize the response surface with fewer 3-level design excluding extremes
runs
k
Experimental design types Fractional factorial Reduce runs using a subset of factorial Half fraction of 2 design
combinations
Experimental design types One factor at a time Vary one factor while holding others Simple screening method
constant
Experimental design types Repeated trials Estimate variability and improve reliability Performing the same experiment multiple times
Experimental design types Taguchi Robust design emphasizing signal-to-noise Orthogonal arrays for process optimization
ratios
Experimental design types Central composite Fit quadratic models in response surface Axial points+factorial design
methodology
k
Experimental design types Full factorial Study all combinations of factors 2 full factorial design
Experimental design types Single factor Investigate one factor in detail Compare multiple levels of a single factor
Experimental design types Randomly distributed Capture variability across random settings Random selection of design points
factor levels
Abbreviations: AIC: Akaike information criterion; AM: Additive manufacturing; ANOVA: Analysis of variance; BIC: Bayesian information criterion;
CI: Confidence interval; DOE: Design of experiments.
To better understand trends in experimental design over analysis. Each of these variables is binary. In addition,
time, we performed a cluster analysis to automatically we also input the type of experimental design and the
categorize different papers and then see how frequencies type of data analysis used. Finally, we incorporated the
in these groups change over time. The variables that sample size. While this is a continuous variable, all other
were used in the cluster analysis were whether a paper factors are categorical. As we used Gower distance to
used blocking, randomization, checked for model calculate the dissimilarity matrix, which is only valid
30
adequacy, performed model selection, and used a power for categorical variables, we converted the sample size
Volume 1 Issue 4 (2025) 7 doi: 10.36922/ESAM025340021