
Page 103 - GHES-1-1
P. 103
Global Health Econ Sustain Effects of community-based activities on LTC needs
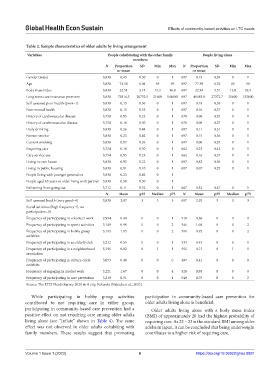
Table 2. Sample characteristics of older adults by living arrangement
Variables People cohabitating with the other family People living alone
members
N Proportion SD Min Max N Proportion SD Min Max
or mean or mean
Gender (male) 3,838 0.45 0.50 0 1 697 0.19 0.39 0 1
Age 3,838 74.58 6.04 65 99 697 77.39 6.76 65 98
Body mass index 3,838 22.51 3.18 15.3 36.8 697 22.34 3.51 12.8 32.5
Long-term care insurance premium 3,838 72914.5 26732.5 21600 144000 697 48483.8 27272.7 21600 132000
Self-assessed poor health (poor=1) 3,838 0.15 0.36 0 1 697 0.18 0.38 0 1
Poor mental health 3,838 0.15 0.35 0 1 697 0.16 0.37 0 1
History of cardiovascular disease 3,758 0.05 0.22 0 1 678 0.06 0.25 0 1
History of cerebrovascular disease 3,758 0.10 0.30 0 1 678 0.08 0.27 0 1
Daily drinking 3,838 0.26 0.44 0 1 697 0.11 0.31 0 1
Former smoker 3,838 0.23 0.42 0 1 697 0.15 0.36 0 1
Current smoking 3,838 0.07 0.26 0 1 697 0.06 0.25 0 1
Requiring care 3,754 0.10 0.30 0 1 662 0.23 0.42 0 1
Care service use 3,754 0.05 0.23 0 1 662 0.16 0.37 0 1
Living in own house 3,838 0.95 0.22 0 1 697 0.82 0.38 0 1
Living in public housing 3,838 0.01 0.10 0 1 697 0.07 0.25 0 1
People living with younger generation 3,838 0.23 0.42 0 1
People aged 65 years or older living with partner 3,838 0.50 0.50 0 1
Refraining from going out 3,712 0.11 0.32 0 1 667 0.32 0.47 0 1
N Mean p25 Median p75 N Mean p25 Median p75
Self-assessed health (very good=4) 3,838 2.97 3 3 3 697 2.92 3 3 3
Social activities (high frequency=5, no
participation=0)
Frequency of participating in volunteer work 2,994 0.44 0 0 1 510 0.36 0 0 0
Frequency of participating in sports activities 3,149 0.99 0 0 2 546 1.04 0 0 2
Frequency of participating in hobby group 3,193 1.05 0 0 2 561 0.92 0 0 2
activities
Frequency of participating in an elderly club 3,212 0.55 0 0 1 534 0.45 0 0 1
Frequency of participating in a neighborhood 3,196 0.82 0 1 1 555 0.71 0 1 1
association
Frequency of participating in culture circle 3,053 0.40 0 0 0 497 0.41 0 0 0
activities
Frequency of engaging in market work 3,221 1.67 0 0 4 528 0.95 0 0 0
Frequency of participating in care prevention 3,210 0.51 0 0 1 549 0.75 0 0 2
Source: The LTCI Needs Survey 2020 in A city, Fukuoka (Fukuda et al., 2023).
While participating in hobby group activities participation in community-based care prevention for
contributed to not requiring care in either group, older adults living alone is beneficial.
participating in community-based care prevention had a Older adults living alone with a body mass index
positive effect on not requiring care among older adults (BMI) of approximately 20 had the highest probability of
living alone (see “Inflate” shown in Table 4). The same requiring care. As 22 – 23 is the standard BMI among older
effect was not observed in older adults cohabiting with adults in Japan, it can be concluded that being underweight
family members. These results suggest that promoting contributes to a higher risk of requiring care.
Volume 1 Issue 1 (2023) 6 https://doi.org/10.36922/ghes.0891