
Page 72 - GHES-1-2
P. 72
Global Health Econ Sustain Stochastic modeling of age at menopausal
of menarche was considered as 15 years, then the expected were found as 34.973 years by logistic distribution and
age of menopause was after 36.480 years of menarche. 36.480 years by the RGLLog distribution. The probability
The waiting time of menopause, when girls get of having menopause at a particular age was given by fitting
menarche at the age of 15 years, was found to be 30.507 probability distribution which was presented in the second
years by logistic distribution and 31.146 by the RGLLog column of the menopausal life table. The information
distribution for 2005 data. Similar figures for 2018 data about the waiting time for menopause, the probability of
surviving or not having menopause at any particular year,
Table 9. Observed and expected value of the number of and the probability of having menopause at any particular
women by several parameter distributions (2018) year provided the expected number of pre- and post-
Age group Observed Expected number of women by menopausal women, which may be helpful to the health
TrLLog KuLLog RGLLog personnel and policymakers to make appropriate planning
45–47 8 0.831 0.549 0.013 about the health facility and other policies.
47–49 21 25.236 26.211 21.057
49–51 95 97.395 98.753 94.905
51–53 23 27.329 28.010 23.269
53–55 5 2.761 0.476 4.097
55–57 2 0.366 0.001 1.129
α 12.995 17.222 4.436
β 9.673 44.635 4.445
γ 40.740 - 45.630
χ 2 0.550 24.597 -
θ - 17.009 2.869
NLL −67.542 −39.554 −34.742
AIC 143.083 87.107 77.484
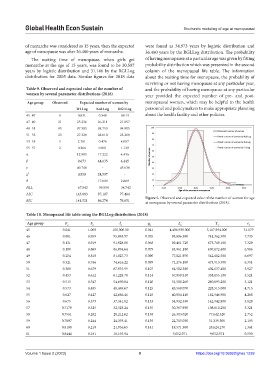
Figure 5. Observed and expected value of the number of women for age
BIC 141.521 86.274 76.651 at menopause by several parameter distributions (2018).
Table 10. Menopausal life table using the RGLLog distribution (2018)
Age group F S l q L T e
x x x x x x x
45 0.041 1.000 100,000.00 0.041 4,406,939.000 5,117,934.000 51.179
46 0.081 0.959 95,863.97 0.055 93,896.390 741,362.500 7.733
47 0.131 0.919 91,928.80 0.068 89,411.720 673,769.100 7.329
48 0.190 0.869 86,894.64 0.079 83,961.180 607,072.400 6.986
49 0.254 0.810 81,027.73 0.090 77,821.970 542,682.500 6.697
50 0.321 0.746 74,616.22 0.099 71,276.100 473,913.500 6.351
51 0.388 0.679 67,935.99 0.107 64,582.380 402,637.400 5.927
52 0.453 0.612 61,228.78 0.114 57,959.810 338,055.100 5.521
53 0.515 0.547 54,690.84 0.120 51,580.260 280,095.200 5.121
54 0.573 0.485 48,469.67 0.125 45,568.070 228,515.000 4.715
55 0.627 0.427 42,666.46 0.129 40,004.140 182,946.900 4.288
56 0.675 0.373 37,341.82 0.133 34,932.530 142,942.800 3.828
57 0.7179 0.325 32,523.24 0.135 30,367.930 108,010.200 3.321
58 0.7561 0.282 28,212.62 0.138 26,303.020 77,642.320 2.752
59 0.7897 0.244 24,393.41 0.139 22,715.030 51,339.300 2.105
60 0.8190 0.210 21,036.65 0.141 19,571.300 28,624.270 1.361
61 0.8444 0.181 18,105.94 - 9,052.971 9,052.971 0.500
Volume 1 Issue 2 (2023) 9 https://doi.org/10.36922/ghes.1239