
Page 71 - GHES-1-2
P. 71
Global Health Econ Sustain Stochastic modeling of age at menopausal
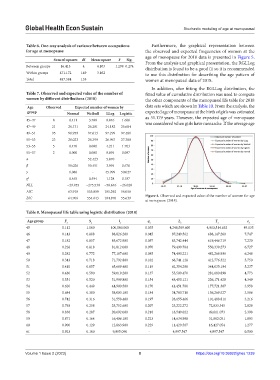
Table 6. One‑way analysis of variance between occupations Furthermore, the graphical representation between
for age at menopause the observed and expected frequencies of women at the
age of menopause for 2018 data is presented in Figure 5.
Sum of squares df Mean square F Sig.
Between groups 16.413 4 4.103 1.298 0.274 From the analysis and graphical presentation, the RGLLog
distribution is found to be a good fit so it is recommended
Within groups 471.172 149 3.162 to use this distribution for describing the age pattern of
Total 487.584 153 women at menopausal data of 2018.
In addition, after fitting the RGLLog distribution, the
Table 7. Observed and expected value of the number of fitted value of cumulative distribution was used to compute
women by different distributions (2018) the other components of the menopausal life table for 2018
Age Observed Expected number of women by data sets which are shown in Table 10. From the analysis, the
group Normal Weibull LLog Logistic expected age of menopause at the birth of girls was estimated
45–47 8 0.411 3.708 0.046 1.660 as 51.179 years. However, the expected age of menopause
was considered when girls have menarche. If the average age
47–49 21 26.131 26.281 24.182 25.684
49–51 95 98.959 97.613 97.299 97.481
51–53 23 28.023 26.399 26.967 27.380
53–55 5 0.476 0.000 4.211 1.703
55–57 2 0.000 0.000 0.894 0.087
α - 52.423 5.870 -
β 50.026 50.451 3.994 0.670
γ 1.086 - 45.999 50.027
χ 2 0.465 0.594 1.128 0.187
NLL −29.955 −275.530 −50.646 −26.028
AIC 63.910 555.059 105.292 56.056
Figure 4. Observed and expected value of the number of women for age
BIC 64.706 554.643 104.876 55.639
at menopause (2018).
Table 8. Menopausal life table using logistic distribution (2018)
Age group F S l q L T e
x x x x x x x
45 0.112 1.000 100,000.000 0.035 4,248,589.600 4,913,514.632 49.135
46 0.143 0.888 88,826.200 0.045 87,249.562 688,147.260 7.747
47 0.182 0.857 85,672.900 0.057 83,742.444 619,446.719 7.230
48 0.228 0.818 81,812.000 0.070 79,499.784 550,339.273 6.727
49 0.282 0.772 77,187.600 0.085 74,490.221 482,268.996 6.248
50 0.343 0.718 71,792.800 0.102 68,741.128 412,776.322 5.750
51 0.410 0.657 65,689.400 0.119 62,354.296 344,035.194 5.237
52 0.480 0.590 59,019.200 0.137 55,509.470 281,680.898 4.773
53 0.551 0.520 51,999.800 0.154 48,450.121 226,171.428 4.349
54 0.620 0.449 44,900.500 0.170 41,451.780 177,721.307 3.958
55 0.684 0.380 38,003.100 0.184 34,780.716 136,269.527 3.586
56 0.742 0.316 31,558.400 0.197 28,655.466 101,488.811 3.216
57 0.793 0.258 25,752.600 0.207 23,222.272 72,833.345 2.828
58 0.836 0.207 20,692.000 0.216 18,549.022 49,611.073 2.398
59 0.871 0.164 16,406.100 0.223 14,634.998 31,062.051 1.893
60 0.900 0.129 12,863.900 0.229 11,429.507 16,427.054 1.277
61 0.923 0.100 9,995.090 - 4,997.547 4,997.547 0.500
Volume 1 Issue 2 (2023) 8 https://doi.org/10.36922/ghes.1239