
Page 69 - GHES-1-2
P. 69
Global Health Econ Sustain Stochastic modeling of age at menopausal
Table 3. Menopausal life table using logistic distribution (2005)
Age group F S l q L T e
x x x x x x x
Below 35 0.004 1.000 100,000.000 0.018 3,493,692.000 4,551,085.000 45.511
35–37 0.021 0.996 99,639.570 0.030 197,529.300 1,057,393.000 10.612
37–39 0.050 0.979 97,889.690 0.067 192,890.000 859,863.700 8.784
39–41 0.114 0.950 95,000.300 0.141 183,615.200 666,973.700 7.021
41–43 0.239 0.886 88,614.940 0.256 164,739.000 483,358.400 5.455
43–45 0.434 0.761 76,124.080 0.385 132,759.500 318,619.400 4.186
45–47 0.651 0.566 56,635.380 0.484 91,488.200 185,860.000 3.282
47–49 0.820 0.349 34,852.830 0.542 52,828.170 94,371.750 2.708
49–51 0.918 0.180 17,975.340 0.569 26,212.710 41,543.580 2.311
51–53 0.965 0.082 8,237.374 0.582 11,784.120 15,330.870 1.861
53–55 0.985 0.035 3,546.746 – 3,546.746 3,546.746 1.000
Table 4. Observed and expected value of the number of
women by several parameter distributions (2005)
Age group Observed Expected number of women by
TrLLog KuLLog RGLLog
Below 35 1 0.578 1.621 0.236
35–37 2 1.124 1.577 0.685
37–39 5 2.957 3.006 2.264
39–41 7 7.017 5.863 6.316
41–43 11 14.192 12.050 13.918
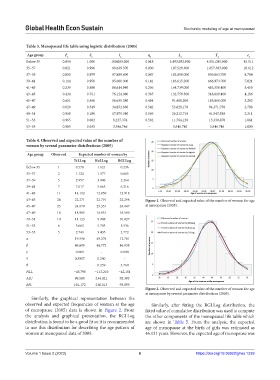
43–45 24 22.271 22.791 22.298 Figure 1. Observed and expected value of the number of women for age
45–47 25 24.678 25.351 24.447 at menopause (2005).
47–49 18 18.985 16.951 18.590
49–51 10 11.123 9.908 10.827
51–53 6 5.663 5.783 5.536
53–55 5 2.749 3.435 2.772
α 19.596 49.378 12.701
β 46.600 44.772 46.938
γ 0.000 - 0.000
λ 0.3907 0.240 -
θ - 0.259 3.760
NLL −45.790 −113.210 −42.151
AIC 99.580 234.421 92.303
BIC 101.172 236.013 93.895
Figure 2. Observed and expected value of the number of women for age
at menopause by several parameter distributions (2005).
Similarly, the graphical representation between the
observed and expected frequencies of women at the age Similarly, after fitting the RGLLog distribution, the
of menopause (2005) data is shown in Figure 2. From fitted value of cumulative distribution was used to compute
the analysis and graphical presentation, the RGLLog the other components of the menopausal life table which
distribution is found to be a good fit so it is recommended are shown in Table 5. From the analysis, the expected
to use this distribution for describing the age pattern of age of menopause at the birth of girls was estimated as
women at menopausal data of 2005. 46.131 years. However, the expected age of menopause was
Volume 1 Issue 2 (2023) 6 https://doi.org/10.36922/ghes.1239