
Page 70 - GHES-1-2
P. 70
Global Health Econ Sustain Stochastic modeling of age at menopausal
considered when girls have menarche. If the average age of 2018 data. From the analysis and graphical presentation,
menarche is considered as 15 years then the expected age the logistic distribution was found to be a good fit so it
of menopause is after 31.146 years of menarche. was recommended to use this distribution, calculate the
Another data set of Nepalese women’s age at menopause waiting time for menopause, and describe the age pattern
was taken from Koirala & Manandhar (2018) and the fitted of women at menopause.
results were compared with the results of 2005 data. Table 2 Moreover, after fitting the logistic distribution, the
shows the descriptive measures of the second data set. fitted value of cumulative distribution was used to compute
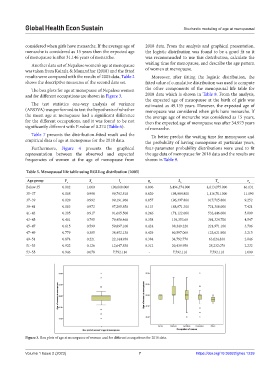
The box plots for age at menopause of Nepalese women the other components of the menopausal life table for
and for different occupations are shown in Figure 3. 2018 data which is shown in Table 8. From the analysis,
the expected age of menopause at the birth of girls was
The test statistics one-way analysis of variance estimated as 49.135 years. However, the expected age of
(ANOVA) was performed to test the hypothesis of whether menopause was considered when girls have menarche. If
the mean age at menopause had a significant difference the average age of menarche was considered as 15 years,
for the different occupations, and it was found to be not then the expected age of menopause was after 34.973 years
significantly different with P-value of 0.274 (Table 6). of menarche.
Table 7 presents the distribution-fitted result and the To better predict the waiting time for menopause and
empirical data of age at menopause for the 2018 data. the probability of having menopause at particular years,
Furthermore, Figure 4 presents the graphical four-parameter probability distributions were used to fit
representation between the observed and expected the age data of menopause for 2018 data and the results are
frequencies of women at the age of menopause from shown in Table 9.
Table 5. Menopausal life table using RGLLog distribution (2005)
Age group F S l q L T e
x x x x x x x
Below 35 0.002 1.000 100,000.000 0.006 3,496,374.000 4,613,075.000 46.131
35–37 0.008 0.998 99,792.810 0.020 198,984.800 1,116,701.000 11.190
37–39 0.028 0.992 99,191.960 0.057 196,397.800 917,715.800 9.252
39–41 0.083 0.972 97,205.850 0.133 188,871.300 721,318.000 7.421
41–43 0.205 0.917 91,665.500 0.246 171,122.000 532,446.600 5.809
43–45 0.401 0.795 79,456.460 0.358 139,353.60 361,324.700 4.547
45–47 0.615 0.599 59,897.100 0.424 98,349.220 221,971.100 3.706
47–49 0.779 0.385 38,452.130 0.429 60,597.060 123,621.900 3.215
49–51 0.874 0.221 22,144.930 0.384 34,792.770 63,024.830 2.846
51–53 0.922 0.126 12,647.830 0.312 20,439.950 28,232.070 2.232
53–55 0.946 0.078 7,792.116 - 7,792.116 7,792.116 1.000
Figure 3. Box plots of age at menopause of women and for different occupations for 2018 data.
Volume 1 Issue 2 (2023) 7 https://doi.org/10.36922/ghes.1239