
Page 90 - GHES-1-2
P. 90
Global Health Econ Sustain Non-communicable diseases household survey
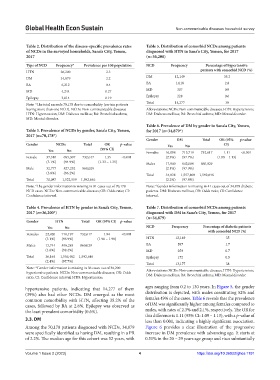
Table 2. Distribution of the disease‑specific prevalence rates Table 5. Distribution of comorbid NCDs among patients
of NCDs in the surveyed households, Sana’a City, Yemen, diagnosed with HTN in Sana’a City, Yemen, for 2017
2017 (n=36,200)
Type of NCD Frequency* Prevalence per 100 population NCD Frequency Percentage of hypertensive
HTN 36,200 2.3 patients with comorbid NCD (%)
DM 34,879 2.2 DM 12,149 35.2
BA 6,212 0.4 BA 1,018 2.8
MD 4,244 0.27 MD 307 0.9
Epilepsy 3,014 0.19 Epilepsy 228 0.6
Total 14,277 39
Note: *The total exceeds 70,178 due to comorbidity (certain patients
having more than one NCD). NCDs: Non-communicable diseases; Abbreviations: NCDs: Non-communicable diseases; HTN: Hypertension;
HTN: Hypertension; DM: Diabetes mellitus; BA: Bronchial asthma; DM: Diabetes mellitus; BA: Bronchial asthma; MD: Mental disorder.
MD: Mental disorder.
Table 6. Prevalence of DM by gender in Sana’a City, Yemen,
Table 3. Prevalence of NCDs by gender, Sana’a City, Yemen, for 2017 (n=34,879*)
2017 (n=70,178*)
Gender DM Total OR (95% p‑value
Gender NCDs Total OR p‑value Yes No CI)
Yes No (95% CI) Females 16,898 715,719 732,617 1.11 <0.001
Female 37,310 695,307 732,617 1.35 <0.001 (2.3%) (97.7%) (1.09 – 1.13)
(5.1%) (94.9%) (1.33 – 1.35) Males 17,940 842,089 860,029
Male 32,777 827,252 860,029 (2.1%) (97.9%)
(3.8%) (96.2%) Total 34,838 1,557,808 1,592,646
Total 70,087 1,522,559 1,592,646 (2.2%) (97.8%)
Note: *The gender information is missing in 91 cases out of 70,178 Note: *Gender information is missing in 41 cases out of 34,879 diabetic
NCD cases. NCDs: Non-communicable diseases; OR: Odds ratio; CI: patients. DM: Diabetes mellitus; OR: Odds ratio; CI: Confidence
Confidence interval. interval.
Table 4. Prevalence of HTN by gender in Sana’a City, Yemen, Table 7. Distribution of comorbid NCDs among patients
2017 (n=36,200*) diagnosed with DM in Sana’a City, Yemen, for 2017
(n=34,879)
Gender HTN Total OR (95% CI) p‑value
Yes No NCD Frequency Percentage of diabetic patients
with comorbid NCD (%)
Females 22,420 710,197 732,617 1.94 <0.001
(3.1%) (96.9%) (1.90 – 1.98) HTN 12,149 35
Males 13,744 846,285 860,029 BA 597 1.7
(1.6%) (98.4%) MD 259 0.7
Total 36,164 1,556,482 1,592,646 Epilepsy 172 0.5
(2.4%) (97.7%)
Total 13,177 38
Note: *Gender information is missing in 36 cases out of 36,200 Abbreviations: NCDs: Non-communicable diseases; HTN: Hypertension;
hypertensive patients. NCDs: Non-communicable diseases; OR: Odds DM: Diabetes mellitus; BA: Bronchial asthma; MD: Mental disorder.
ratio; CI: Confidence interval; HTN: Hypertension.
hypertensive patients, indicating that 14,277 of them ages ranging from 0.2 to 130 years. In Figure 5, the gender
(39%) also had other NCDs. DM emerged as the most distribution is depicted, with males constituting 52% and
common comorbidity with HTN, affecting 35.2% of the females 49% of the cases. Table 6 reveals that the prevalence
cases, followed by BA at 2.8%. Epilepsy was observed as of DM was significantly higher among females compared to
the least prevalent comorbidity (0.6%). males, with rates of 2.3% and 2.1%, respectively. The OR for
this difference is 1.11 (95% CI: 1.09 – 1.13), with a p-value of
3.3. DM less than 0.001, indicating a highly significant association.
Among the 70,178 patients diagnosed with NCDs, 34,879 Figure 6 provides a clear illustration of the progressive
were specifically identified as having DM, resulting in a PR increase in DM prevalence with advancing age. It starts at
of 2.2%. The median age for this cohort was 52 years, with 0.51% in the 20 – 29 years age group and rises substantially
Volume 1 Issue 2 (2023) 4 https://doi.org/10.36922/ghes.1191