
Page 118 - GHES-2-1
P. 118
Global Health Econ Sustain Prolonged impact of health-care expenditure on poverty
This study focuses on 20 low- and middle-income standards, and budget monitoring to underscore the
countries and investigates the data from 2000 to 2018, importance of health spending, placing it among their highest
Appendices 1 and 2. This research rigorously applies priorities. This observation prompts a crucial question: What
the autoregressive distributed lag (ARDL) bounds measures are essential to ensure protection from poverty,
methodology to scrutinize the connection between the and does increased spending on health effectively balance
poverty rate and healthcare service expenditures within the interconnected factors to achieve optimal equilibrium?
the specified countries, period of time, and factors. The primary objective of this study is to ascertain the
Acknowledging the diverse definitions and measurements impact of health expenditures on the spread of poverty
of global poverty, the World Bank’s 2021 indicators in low- and middle-income countries and explore the
highlight the monetary threshold of a country’s national existence of a long-term relationship between these
poverty line. This threshold represents the point at which two variables. To address key questions related to the
meeting an individual’s minimum basic needs becomes topic, this study aimed to gauge the extent to which
challenging, considering the country’s economic and social health expenditure influences poverty and scrutinize the
conditions. Moreover, this study recognizes the dynamic assumption that health expenditure serves as a catalyst for
nature of poverty as countries develop. The study aims to an increase in the poverty ratio in low- and middle-income
determine the impact of spending on health as a criterion
for measuring the optimal use of resources. countries. The research presents a valuable contribution by
revealing an additional determinant of health financing
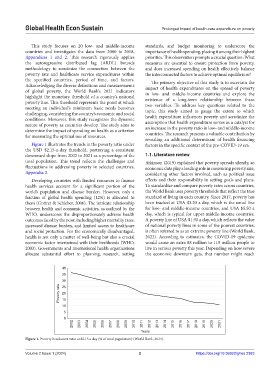
Figure 1 illustrates the trends in the poverty ratio under factors in the specific context of the pre-COVID-19 era.
the USD $2.15-a-day threshold, portraying a consistent
downward slope from 2002 to 2021 as a percentage of the 1.1. Literature review
total population. This trend reflects the challenges and Atkinson (2019) explained that poverty spreads silently, so
fluctuations in addressing poverty in selected countries, economic data play a leading role in measuring poverty size,
Appendix 3. considering other factors involved, such as political issue
Developing countries with limited resources to finance effects and their responsibility in setting goals and plans.
health services account for a significant portion of the To standardize and compare poverty rates across countries,
world’s population and disease burden. However, only a the World Bank uses poverty thresholds that reflect the true
fraction of global health spending (12%) is allocated to standard of living in each country. Since 2017, poverty has
them (Gottret & Schieber, 2006). The intricate relationship been tracked at USA $3.20 a day, which is the usual line
between health and economic activities, as outlined by the for low- and middle-income countries, and USA $5.50 a
WHO, underscores the disproportionately adverse health day, which is typical for upper-middle-income countries.
outcomes faced by the poor, including higher mortality rates, A poverty line of USA $1.90 a day, which reflects the value
increased disease burden, and limited access to healthcare of national poverty lines in some of the poorest countries,
and social protection. For the economically disadvantaged, is often referred to as an extreme poverty line (World Bank,
health is not only a matter of well-being but also a crucial 2022). According to estimates, the COVID-19 epidemic
economic factor intertwined with their livelihoods (WHO, would cause an extra 88 million to 115 million people to
2003). Governments and international health organizations live in serious poverty this year. Depending on how severe
allocate substantial effort to planning, research, setting the economic downturn gets, that number might reach
40
35
30
Poverty rate 20
25
15
10
5
0
2002 2003 2004 2005 2006 2007 2008 2009 2010 2011 2012 2013 2014 2015 2016 2017 2018 2019 2020 2021
Years
Figure 1. Poverty headcount ratio at $2.15 a day (% of total population) (World Bank, 2024).
Volume 2 Issue 1 (2024) 2 https://doi.org/10.36922/ghes.2383