
Page 100 - GHES-2-2
P. 100
Global Health Econ Sustain COVID-19 vaccine uptake in Kwara State
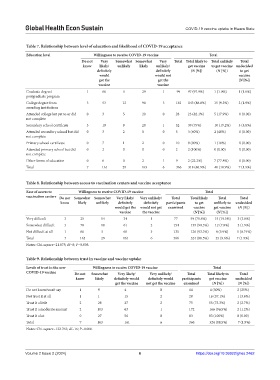
Table 7. Relationship between level of education and likelihood of COVID‑19 acceptance
Education level Willingness to receive COVID‑19 vaccine Total
Do not Very Somewhat Somewhat Very Total Total likely to Total unlikely Total
know likely/ unlikely likely unlikely/ get vaccine to get vaccine undecided
definitely definitely (N [%]) (N [%]) to get
would would not vaccine
get the get the (N [%])
vaccine vaccine
Graduate degree/ 1 68 0 29 1 99 97 (97.9%) 1 (1.0%) 1 (1.0%)
postgraduate program
College degree from 3 53 12 90 3 161 143 (88.8%) 15 (9.3%) 3 (1.9%)
awarding institutions
Attended college but yet to or did 0 3 5 20 0 28 23 (82.1%) 5 (17.9%) 0 (0.00)
not complete
Secondary school certificate 3 19 9 20 1 52 39 (75%) 10 (19.2%) 3 (5.8%)
Attended secondary school but did 0 3 2 0 0 5 3 (60%) 2 (40%) 0 (0.00)
not complete
Primary school certificate 0 7 1 2 0 10 9 (90%) 1 (10%) 0 (0.00)
Attended primary school but did 0 2 0 0 0 2 2 (100%) 0 (0.00) 0 (0.00)
not complete
Other forms of education 0 6 0 2 1 9 2 (22.2%) 7 (77.8%) 0 (0.00)
Total 7 161 29 163 6 366 318 (86.9%) 40 (10.9%) 7 (1.9%)
Table 8. Relationship between access to vaccination centers and vaccine acceptance
Ease of access to Willingness to receive COVID‑19 vaccine Total
vaccination centers Do not Somewhat Somewhat Very likely/ Very unlikely/ Total Total likely Total Total
know likely unlikely definitely definitely participants to get unlikely to undecided
would get the would not get examined vaccine get vaccine (N [%])
vaccine the vaccine (N [%]) (N [%])
Very difficult 3 25 14 34 1 77 59 (76.6%) 15 (19.5%) 3 (3.8%)
Somewhat difficult 3 78 10 61 2 154 139 (90.3%) 12 (7.8%) 3 (1.9%)
Not difficult at all 1 60 5 66 3 135 126 (93.3%) 8 (5.9%) 1 (0.74%)
Total 7 163 29 161 6 366 324 (88.5%) 35 (9.6%) 7 (1.9%)
Notes: Chi-square=21.875; df=8; P=0.005.
Table 9. Relationship between trust in vaccine and vaccine uptake
Levels of trust in the new Willingness to receive COVID‑19 vaccine Total
COVID‑19 vaccine Do not Somewhat Very likely/ Very unlikely/ Total Total likely to Total
know likely definitely would definitely would participants get vaccine undecided
get the vaccine not get the vaccine examined (N [%]) (N [%])
Do not know/won’t say 1 9 4 0 14 4 (50%) 2 (25%)
Not trust it at all 1 1 15 2 28 16 (57.1%) 1 (3.6%)
Trust it a little 2 28 27 2 75 55 (73.3%) 2 (2.7%)
Trust it a moderate amount 2 103 63 1 172 166 (96.5%) 2 (1.2%)
Trust it a lot 0 27 56 0 83 83 (100%) 0 (0.00)
Total 7 163 161 6 366 324 (88.5%) 7 (1.9%)
Notes: Chi-square=132.763; df=16; P=0.000.
Volume 2 Issue 2 (2024) 6 https://doi.org/10.36922/ghes.2462