
Page 112 - GHES-2-2
P. 112
Global Health Econ Sustain Antenatal care attendance
and 1.8% at BCH). Travel time to the hospitals showed health center (χ [7] = 105.11; p < 0.001). The proportions
2
that the majority of the study participants spent between of participants who responded, “ANC was important for
10 and 29 min from home to the hospitals, comprising both mother and baby,” were 38.1% at AGH and 70.8% at
45% at AGH and 47.6% at BCH. Study participants who BCH. Similarly, 25.7% of participants at AGH, compared to
spent more than 1 h to get to hospitals comprised 3.3% at 17.4% at BCH, responded with “feeling sick.” In addition,
AGH and 5.5% at BCH (Table 2). Concerning the cost of when asked about the timing of IPTp administration,
transportation, the majority of participants at the time of 46.6% of ANC participants at BCH responded “after
the study spent between 1 and 5 cedis (<0.40 USD; one cedi the first trimester exclusively,” in contrast to 21.1% of
is approximately 0.081 USD) to get to the hospital facilities ANC participants at AGH, who gave the same response.
(59.4% at AGH and 46.3% at BCH; χ [5] = 78.52; p < 0.001). Furthermore, 78.5% of participants at AGH responded
2
with “do not know,” compared to 49.0% at BCH (Table 3).
3.3. Knowledge about antenatal care and
intermittent preventive treatment in pregnancy 3.4. Antenatal care attendance and intermittent
To assess participants’ knowledge of the importance of preventive treatment in pregnancy administration
ANC, study participants were asked, “Why did you decide Table 4 summarizes information collated from the ANC
to visit the health center?” Their responses included booklets of participants at delivery, including total ANC
“feeling sick,” “knowing the importance of ANC for the visits, doses of IPTp-SP administered, and prenatal
baby only,” and “knowing the importance of ANC for the complications or emergency visits. ANC visits were
mother and for the baby” (Table 3). categorized into participants who made less than four
A statistically significant association was observed (<4) visits, between four and seven (4–7) visits, and more
between the “reason for attending ANC” and the choice of than seven (>7) visits. Results indicate that the majority of
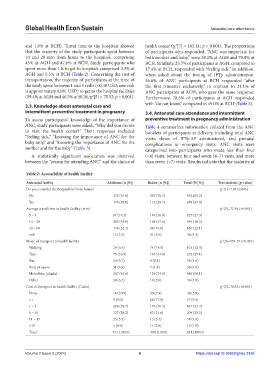
Table 2: Accessibility of health facility
Antenatal facility Adidome (n [%]) Battor (n [%]) Total (N [%]) Test statistic (p‑value)
2
Do you consider the hospital far from house? χ (1)=7.84 (0.005)
No 275 (61.0) 267 (70.3) 542 (65.2)
Yes 176 (39.0) 113 (29.7) 289 (34.8)
Average travel time to health facility (min) χ (3)=72.49 (<0.001)
2
5 – 9 87 (19.3) 140 (36.8) 227 (27.3)
10 – 29 203 (45.0) 181 (47.6) 384 (46.2)
30 – 60 146 (32.4) 38 (10.0) 184 (22.1)
>60 15 (3.3) 21 (5.5) 36 (4.3)
Mode of transport to health facility χ (9)=154.15 (<0.001)
2
Walking 29 (6.4) 74 (19.5) 103 (12.4)
Taxi 75 (16.6) 167 (44.0) 242 (29.1)
Bus 30 (6.7) 8 (2.1) 38 (4.6)
Boat or canoe 31 (6.9) 7 (1.8) 38 (4.6)
Motorbike (okada) 287 (63.6) 129 (34.0) 416 (50.1)
Other 30 (6.7) 10 (2.6) 40 (4.8)
2
Cost of transport to health facility (Cedis) χ (5)=78.52 (<0.001)
None 18 (3.99) 30 (7.9) 48 (5.8)
<1 9 (2.0) 68 (17.9) 77 (9.3)
1 – 5 268 (59.4) 176 (46.3) 444 (53.4)
6 – 10 127 (28.2) 82 (21.6) 209 (25.2)
11 – 15 25 (5.5) 13 (3.4) 38 (4.6)
>15 4 (0.9) 11 (2.9) 15 (1.8)
Total 451 (100.0) 380 (100.0) 831 (100.0)
Volume 2 Issue 2 (2024) 6 https://doi.org/10.36922/ghes.2336