
Page 123 - GHES-2-2
P. 123
Global Health Econ Sustain COVID-19: Mental health in South-South Nigeria
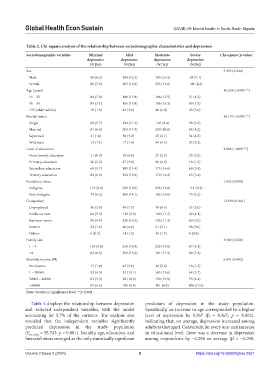
Table 2. Chi‑square analysis of the relationship between sociodemographic characteristics and depression
Sociodemographic variables Minimal Mild Moderate Severe Chi‑square (p‑value)
depression depression depression depression
(N [%]) (N [%]) (N [%]) (N [%])
Sex 3.323 (0.344)
Male 98 (8.2) 194 (16.2) 195 (16.3) 85 (7.1)
Female 88 (7.3) 203 (16.9) 235 (19.6) 101 (8.4)
Age (years) 36.624 (<0.001**)
18 – 35 84 (7.0) 189 (15.8) 186 (15.5) 51 (4.2)
36 – 55 85 (7.1) 165 (13.8) 196 (16.3) 90 (7.5)
>55 (older adults) 18 (1.5) 43 (3.6) 48 (4.0) 45 (3.8)
Marital status 36.137 (<0.001**)
Single 68 (5.7) 134 (11.2) 101 (8.4) 38 (3.2)
Married 81 (6.8) 208 (17.3) 250 (20.8) 98 (8.2)
Separated 31 (14) 38 (3.2) 25 (2.1) 54 (4.5)
Widowed 13 (1.1) 17 (1.4) 54 (4.5) 25 (2.1)
Level of education 2.806 (<0.001**)
None formal education 11 (0.9) 10 (0.8) 27 (2.3) 33 (2.8)
Primary education 26 (2.2) 47 (3.9) 58 (4.8) 18 (1.5)
Secondary education 68 (5.7) 185 (15.4) 175 (14.6) 69 (5.8)
Tertiary education 82 (6.8) 154 (12.9) 170 (14.2) 65 (5.4)
Residence status 1.832 (0.608)
Indigene 113 (9.4) 228 (19.0) 238 (19.8) 111 (9.2)
Non-indigene 74 (6.2) 169 (14.1) 192 (16.0) 75 (6.2)
Occupation 12.059 (0.441)
Unemployed 36 (3.0) 90 (7.5) 78 (6.5) 31 (2.6)
Public servant 64 (5.3) 119 (9.9) 140 (11.7) 49 (4.1)
Business owner 59 (4.9) 126 (10.5) 136 (11.3) 60 (5.0)
Farmer 22 (1.8) 48 (4.0) 61 (5.1) 36 (3.0)
Others 6 (0.5) 14 (1.2) 15 (1.3) 9 (0.8)
Family size 3.509 (0.320)
1 – 3 105 (8.8) 238 (19.8) 239 (19.9) 97 (8.1)
≥4 82 (6.8) 159 (13.2) 191 (15.9) 89 (7.4)
Monthly income (₦) 8.951 (0.442)
No income 17 (1.4) 43 (3.6) 34 (2.8) 16 (1.3)
1 – 30000 52 (4.3) 33 (11.1) 163 (13.6) 68 (5.7)
30000 – 40000 63 (5.3) 20 (10.0) 130 (10.9) 53 (4.4)
>40000 55 (4.6) 100 (8.4) 101 (8.4) 186 (15.5)
Note: Statistical significance level: **p<0.001.
Table 5 displays the relationship between depression predictors of depression in the study population.
and selected independent variables, with the model Specifically, an increase in age corresponded to a higher
accounting for 5.7% of the variance. The analysis also level of depression by 0.367 (β = 0.367; p = 0.002),
revealed that the independent variables significantly indicating that, on average, depression increased among
predicted depression in the study population adults as they aged. Conversely, for every one-unit increase
(F [9,1176] = 55.743; p < 0.001). Notably, age, education, and in educational level, there was a decrease in depression
financial stress emerged as the only statistically significant among respondents by −0.258 on average (β = −0.258,
Volume 2 Issue 2 (2024) 5 https://doi.org/10.36922/ghes.2551