
Page 125 - GHES-2-2
P. 125
Global Health Econ Sustain COVID-19: Mental health in South-South Nigeria
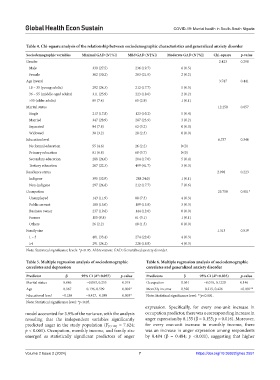
Table 4. Chi‑square analysis of the relationship between sociodemographic characteristics and generalized anxiety disorder
Sociodemographic variables Minimal GAD (N [%]) Mild GAD (N [%]) Moderate GAD (N [%]) Chi‑square p‑value
Gender 2.423 0.298
Male 330 (27.5) 236 (19.7) 6 (0.5)
Female 362 (30.2) 263 (21.9) 2 (0.2)
Age (years) 3.747 0.441
18 – 35 (young adults) 292 (24.3) 212 (17.7) 5 (0.5)
36 – 55 (middle-aged adults) 311 (25.9) 223 (18.6) 2 (0.2)
>55 (older adults) 89 (7.4) 65 (2.9) 1 (0.1)
Marital status 12.250 0.057
Single 213 (17.8) 123 (10.2) 5 (0.4)
Married 347 (28.9) 287 (23.9) 3 (0.2)
Separated 94 (7.8) 62 (5.2) 0 (0.0)
Widowed 38 (3.2) 28 (2.3) 0 (0.0)
Education level 6.737 0.346
No formal education 55 (4.6) 26 (2.2) 0 (0)
Primary education 81 (6.8) 68 (5.7) 0 (0)
Secondary education 288 (24.0) 204 (17.0) 5 (0.4)
Tertiary education 267 (22.3) 499 (41.7) 3 (0.3)
Residence status 2.998 0.223
Indigene 395 (32.9) 288 24.0) 1 (0.1)
Non-indigene 297 (24.8) 212 (17.7) 7 (0.6)
Occupation 25.750 0.001*
Unemployed 143 (11.9) 88 (7.3) 4 (0.3)
Public servant 180 (15.0) 189 (15.8) 3 (0.3)
Business owner 237 (19.8) 144 (12.0) 0 (0.0)
Farmer 105 (8.8) 61 (5.1) 1 (0.1)
Others 26 (2.2) 18 (1.5) 0 (0.0)
Family size 1.313 0.519
1 – 3 401 (33.4) 274 (22.8) 4 (0.3)
≥4 291 (24.2) 226 (18.8) 4 (0.3)
Note: Statistical significance levels: *p<0.05. Abbreviation: GAD: Generalized anxiety disorder.
Table 5. Multiple regression analysis of sociodemographic Table 6. Multiple regression analysis of sociodemographic
correlates and depression correlates and generalized anxiety disorder
Predictor β 95% CI (R =0.057) p‑value Predictors β 95% CI (R =0.033) p‑value
2
2
Marital status 0.086 −0.083, 0.255 0.319 Occupation 0.051 −0.018, 0.1220 0.146
Age 0.367 0.136, 0.599 0.002* Monthly income 0.320 0.215, 0.426 <0.001**
Educational level −0.258 −0.427, -0.089 0.003* Note: Statistical significance level: **p<0.001.
Note: Statistical significance level: *p<0.05.
expression. Specifically, for every one-unit increase in
model accounted for 3.9% of the variance, with the analysis occupation predictor, there was a corresponding increase in
revealing that the independent variables significantly anger expression by 0.155 (β = 0.155; p = 0.016). Moreover,
predicted anger in the study population (F [7,1184] = 7.824; for every one-unit increase in monthly income, there
p < 0.001). Occupation, monthly income, and family size was an increase in anger expression among respondents
emerged as statistically significant predictors of anger by 0.484 (β = 0.484; p <0.001), suggesting that higher
Volume 2 Issue 2 (2024) 7 https://doi.org/10.36922/ghes.2551