Page 124 - GHES-2-2
P. 124

Global Health Econ Sustain                                     COVID-19: Mental health in South-South Nigeria


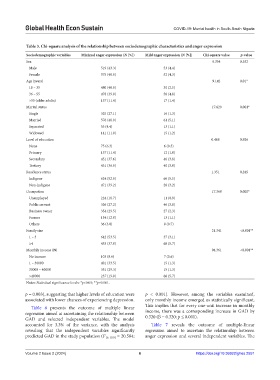
            Table 3. Chi‑square analysis of the relationship between sociodemographic characteristics and anger expression
            Sociodemographic variables  Minimal anger expression (N [%])  Mild anger expression (N [%])  Chi‑square value  p‑value
            Sex                                                                                   0.354  0.552
             Male                           519 (43.3)                 53 (4.4)
             Female                         575 (48.0)                 52 (4.3)
            Age (years)                                                                           9.142  0.01*
             18 – 35                        480 (40.0)                 30 (2.5)
             36 – 55                        478 (39.8)                 58 (4.8)
             >55 (older adults)             137 (11.4)                 17 (1.4)
            Marital status                                                                 17.629      0.001*
             Single                         325 (27.1)                 16 (1.3)
             Married                        576 (48.0)                 61 (5.1)
             Separated                                     53 (4.4)    13 (1.1)
             Widowed                        141 (11.8)                 15 (1.2)
            Level of education                                                                   0.468  0.926
             None                                          75 (6.3)                        6 (0.5)
             Primary                        137 (11.4)                 12 (1.0)
             Secondary                      451 (37.6)                 46 (3.8)
             Tertiary                       431 (36.0)                 40 (3.0)
            Residence status                                                                     1.351  0.245
             Indigene                       624 (52.0)                 66 (5.5)
             Non-indigene                   471 (39.2)                 28 (3.2)
            Occupation                                                                     17.368      0.002*
             Unemployed                     224 (18.7)                 11 (0.9)
             Public servant                 326 (27.2)                 46 (3.8)
             Business owner                 354 (29.5)                 27 (2.3)
             Farmer                         154 (12.8)                 13 (1.1)
             Others                                        36 (3.0)                        8 (0.7)
            Family size                                                                    21.341      <0.001**
             1 – 3                          642 (53.5)                 37 (3.1)
             ≥4                             453 (37.8)                 68 (5.7)
            Monthly income (₦)                                                             94.361      <0.001**
             No income                                     103 (8.6)                        7 (0.6)
             1 – 30000                      401 (33.5)                 15 (1.3)
             30000 – 40000                  351 (29.3)                 15 (1.3)
             >40000                         237 (19.8)                 68 (5.7)
            Notes: Statistical significance levels: *p<0.05; **p<0.001.

            p = 0.003), suggesting that higher levels of education were   p  < 0.001). However, among the variables examined,
            associated with lower chances of experiencing depression.  only monthly income emerged as statistically significant.
                                                               This implies that for every one-unit increase in monthly
              Table 6 presents the outcome of multiple linear
            regression aimed at ascertaining the relationship between   income, there was a corresponding increase in GAD by
            GAD and selected independent variables. The model   0.320 (β = 0.320; p ≤ 0.001).
            accounted for 3.3% of the variance, with the analysis   Table 7 reveals the outcome of multiple-linear
            revealing that the independent variables significantly   regression aimed to ascertain the relationship between
            predicted GAD in the study population (F [6, 1183] = 20.584;   anger expression and several independent variables. The


            Volume 2 Issue 2 (2024)                         6                        https://doi.org/10.36922/ghes.2551
   119   120   121   122   123   124   125   126   127   128   129