
Page 122 - GHES-2-2
P. 122
Global Health Econ Sustain COVID-19: Mental health in South-South Nigeria
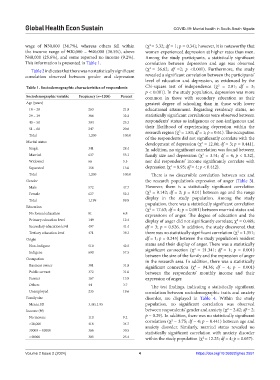
wage of ₦30,000 (34.7%), whereas others fell within (χ = 3.32; df = 1; p = 0.34); however, it is noteworthy that
2
the income range of ₦30,000 – ₦40,000 (30.5%), above women experienced depression at higher rates than men.
₦40,000 (25.6%), and some reported no income (9.2%). Among the study participants, a statistically significant
This information is presented in Table 1. correlation between depression and age was observed
2
Table 2 indicates that there was no statistically significant (χ = 36.62; df =2; p <0.001). Furthermore, the study
correlation observed between gender and depression revealed a significant correlation between the participants’
level of education and depression, as evidenced by the
2
Table 1. Sociodemographic characteristics of respondents Chi-square test of independence (χ = 2.81; df = 3;
p < 0.001). In the study population, depression was more
Sociodemographic variable Frequency (n=1200) Percent common in those with secondary education as their
Age (years) greatest degree of schooling than in those with lower
18 – 28 263 21.8 educational attainment. Regarding residency status, no
29 – 39 386 32.2 statistically significant correlations were observed between
40 – 50 304 25.3 respondents’ status as indigenous or non-indigenous and
51 – 60 247 20.6 their likelihood of experiencing depression within the
2
Total 1,200 100.0 research region (χ = 1.83; df = 1; p = 0.61). The occupation
of the respondents did not significantly correlate with the
Marital status development of depression (χ = 12.06; df = 3; p = 0.441).
2
Single 341 28.4 In addition, no significant correlation was found between
Married 637 53.1 family size and depression (χ = 3.51; df = 4; p < 0.32),
2
Widowed 66 5.5 nor did respondents’ income significantly correlate with
2
Separated 156 13.0 depression (χ = 8.95; df = 4; p < 0.442).
Total 1,200 100.0 There is no discernible correlation between sex and
Gender the research population’s expression of anger (Table 3).
Male 572 47.7 However, there is a statistically significant correlation
2
Female 627 52.3 (χ = 9.142; df = 2; p = 0.01) between age and the range
Total 1,199 99.9 display in the study population. Among the study
population, there was a statistically significant correlation
Education (χ = 17.63; df = 4; p = 0.001) between married status and
2
No formal education 81 6.8 expressions of anger. The degree of education and the
Primary education level 149 12.4 display of anger did not significantly correlate; χ = 0.468;
2
Secondary education level 497 41.4 df = 3; p = 0.926. In addition, the study discovered that
2
Tertiary education level 471 39.3 there was no statistically significant correlation (χ = 1.351;
Origin df = 1; p = 0.245) between the study population’s resident
Non-indigene 510 42.5 status and their display of anger. There was a statistically
2
Indigene 690 57.5 significant connection (χ = 21.341; df = 1; p = 0.001)
Occupation between the size of the family and the expression of anger
in the research area. In addition, there was a statistically
Business owner 381 31.8 significant connection (χ = 94.36; df = 4; p = 0.001)
2
Public servant 372 31.0 between the respondents’ monthly income and their
Farmer 167 13.9 expression of anger.
Others 44 3.7 The test findings, indicating a statistically significant
Unemployed 235 19.6 correlation between sociodemographic traits and anxiety
Family size disorder, are displayed in Table 4. Within the study
Mean±SD 3.48±1.95 population, no significant correlation was observed
2
Income (₦) between respondents’ gender and anxiety (χ = 2.42; df = 2;
No income 110 9.2 p = 0.29). In addition, there was no statistically significant
2
<30,000 416 34.7 correlation (χ = 3.75; df = 4; p = 0.441) between age and
anxiety disorder. Similarly, married status revealed no
30000 – 40000 366 30.5 statistically significant correlation with anxiety disorder
>40000 305 25.4 within the study population (χ = 12.25; df = 4; p = 0.057).
2
Volume 2 Issue 2 (2024) 4 https://doi.org/10.36922/ghes.2551