Page 81 - GHES-2-2
P. 81

Global Health Econ Sustain                                     Prevalence and risk factors of childhood diarrhea


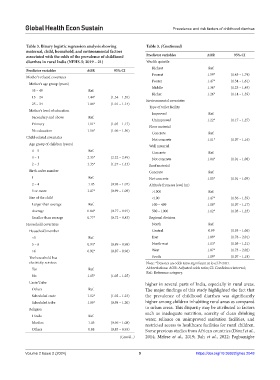
            Table 3. Binary logistic regression analysis showing   Table 3. (Continued)
            maternal, child, household, and environmental factors
            associated with the odds of the prevalence of childhood   Predictor variables  AOR       95% CI
            diarrhea in rural India (NFHS‑5; 2019 – 21)        Wealth quintile
                                                                  Richest                 Ref.
            Predictor variables       AOR         95% CI
                                                                  Poorest                1.59*     (1.45 – 1.74)
            Mother’s related covariates
                                                                  Poorer                 1.47*     (1.34 – 1.61)
             Mother’s age group (years)
                                                                  Middle                 1.36*     (1.23 – 1.49)
               35 – 49                 Ref.
                                                                  Richer                 1.26*     (1.14 – 1.39)
               15 – 24                1.44*     (1.34 – 1.55)
                                                               Environmental covariates
               25 – 34                1.06*     (1.01 – 1.14)
                                                                Type of toilet facility
             Mother’s level of education
                                                                  Improved                Ref.
               Secondary and above     Ref.
                                                                  Unimproved             1.22*     (1.17 – 1.27)
               Primary                1.11*     (1.05 – 1.17)
                                                                Floor material
               No education           1.16*     (1.06 – 1.30)
                                                                  Concrete                Ref.
            Child-related covariates
                                                                  Not concrete           1.11*     (1.07 – 1.16)
             Age group of children (years)                      Wall material
               4 – 5                   Ref.                       Concrete                Ref.
               0 – 1                  2.35*     (2.22 – 2.49)     Not concrete           1.04*     (1.01 – 1.08)
               2 – 3                  1.35*     (1.27 – 1.43)   Roof material
             Birth order number                                 Concrete                  Ref.
               1                       Ref.                     Not concrete             1.05*     (1.01 – 1.09)
               2 – 4                   1.05     (0.98 – 1.07)   Altitude from sea level (m)
               5 or more              1.07*     (0.99 – 1.09)     >1000                   Ref.
             Size of the child                                    <100                   1.47*     (1.36 – 1.59)
               Larger than average     Ref.                       100 – 499              1.08*     (1.07 – 1.17)
               Average                0.84*     (0.77 – 0.91)     500 – 1000             1.12*     (1.03 – 1.23)
               Smaller than average   0.77*     (0.72 – 0.83)   Regional division
            Household covariates                                  North                   Ref.
             Household member                                     Central                 0.99     (0.93 – 1.06)
               <5                      Ref.                       East                   1.89*     (1.78 – 2.01)
               5 – 6                  0.94*     (0.89 – 0.98)     North-east             1.13*     (1.05 – 1.21)
               >6                     0.92*     (0.87 – 0.96)     West                   1.87*     (1.73 – 2.02)
             The household has                                    South                  1.09*     (1.07 – 1.18)
             electricity services                              Note: *Denotes an odds ratio significant at level P<0.01.
               Yes                     Ref.                    Abbreviations: AOR: Adjusted odds ratio; CI: Confidence interval;
                                                               Ref.: Reference category.
               No                     1.15*     (1.05 – 1.25)
             Caste/Tribe                                       higher in several parts of India, especially in rural areas.
               Others                  Ref.                    The major findings of this study highlighted the fact that
               Scheduled caste        1.12*     (1.02 – 1.23)  the prevalence of childhood diarrhea was significantly
               Scheduled tribe        1.09*     (0.98 – 1.20)  higher among children inhabiting rural areas as compared
             Religion                                          to urban areas. This disparity may be attributed to factors
               Hindu                   Ref.                    such as inadequate nutrition, scarcity of clean drinking
                                                               water, reliance on unimproved sanitation facilities, and
               Muslim                  1.05     (0.96 – 1.08)  restricted access to healthcare facilities for rural children.
               Others                  0.88     (0.83 – 0.93)  Some previous studies from African countries (Diouf et al.,
                                                    (Cont’d...)  2014; Melese  et al., 2019; Bah  et al., 2022; Fagbamigbe


            Volume 2 Issue 2 (2024)                         9                        https://doi.org/10.36922/ghes.2048
   76   77   78   79   80   81   82   83   84   85   86