
Page 76 - GHES-2-2
P. 76
Global Health Econ Sustain Prevalence and risk factors of childhood diarrhea
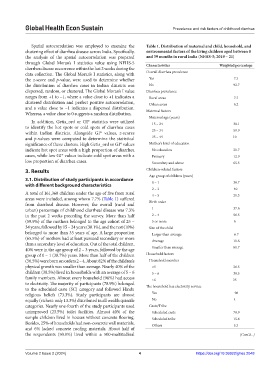
Spatial autocorrelation was employed to examine the Table 1. Distribution of maternal and child, household, and
clustering effect of diarrhea disease across India. Specifically, environmental factors of the living children aged between 0
the analysis of the spatial autocorrelation was prepared and 59 months in rural India (NFHS‑5; 2019 – 21)
through Global Moran’s I statistics value using NFHS-5 Characteristics Weighted percentage
diarrhea disease occurrence within the last 2 weeks during the
data collection. The Global Moran’s I statistics, along with Overall diarrhea prevalence
the z-score and p-value, were used to determine whether Yes 7.3
the distribution of diarrhea cases in Indian districts was No 92.7
dispersed, random, or clustered. The Global Moran’s I value Diarrhea prevalence
ranges from +1 to −1, where a value close to +1 indicates a Rural areas 7.7
clustered distribution and perfect positive autocorrelation, Urban areas 6.2
and a value close to −1 indicates a dispersed distribution. Maternal factors
Whereas, a value close to 0 suggests a random distribution.
Maternal age (years)
In addition, Getis_ord or GI* statistics were utilized 15 – 24 30.1
to identify the hot spots or cold spots of diarrhea cases
within Indian districts. Alongside GI* values, z-scores 25 – 34 59.9
and p-values were computed to determine the statistical 35 – 49 10
significance of these clusters. High Getis_ord or GI* values Mother’s level of education
indicate hot spot areas with a high proportion of diarrhea No education 21.7
cases, while low GI* values indicate cold spot areas with a Primary 12.9
low proportion of diarrhea cases. Secondary and above 65.5
3. Results Children-related factors
Age group of children (years)
3.1. Distribution of study participants in accordance 0 – 1 38.7
with different background characteristics
2 – 3 40
A total of 161,368 children under the age of five from rural 4 – 5 21.3
areas were included, among whom 7.7% (Table 1) suffered
from diarrheal disease. However, the overall (rural and Birth order
urban) percentage of childhood diarrheal disease was 7.3% 1 37.6
in the past 2 weeks preceding the survey. More than half 2 – 4 56.5
(59.9%) of the mothers belonged to the age cohort of 25 – 5 or more 6
34 years, followed by 15 – 24 years (30.1%), and the rest (10%) Size of the child
belonged to more than 35 years of age. A large proportion Larger than average 6.7
(65.5%) of mothers had at least pursued secondary or more Average 11.6
than a secondary level of education. Out of the total children,
40% were in the age group of 2 – 3 years, followed by the age Smaller than average 81.7
group of 0 – 1 (38.7%) years. More than half of the children Household factors
(56.5%) were born on orders 2 – 4. About 82% of the children’s Household member
physical growth was smaller than average. Nearly 40% of the <5 26.5
children (38.5%) lived in households with an average of 5 – 6 5 – 6 38.5
family members. Almost every household (96%) had access >6 35
to electricity. The majority of participants (78.9%) belonged The household has electricity service
to the scheduled caste (SC) category and followed Hindu
religious beliefs (73.3%). Study participants are almost Yes 96
equally (richest: only 13.3%) distributed in all wealth quintile No 4
categories. Nearly one-fourth of the study participants used Caste/Tribe
unimproved (23.5%) toilet facilities. Almost 40% of the Scheduled caste 78.9
sample children lived in houses without concrete flooring. Scheduled tribe 15.8
Besides, 25% of households had non-concrete wall materials, Others 5.3
and 6% lacked concrete roofing materials. About half of
the respondents (50.9%) lived within a 500-maltitudinal (Cont’d...)
Volume 2 Issue 2 (2024) 4 https://doi.org/10.36922/ghes.2048