
Page 158 - GHES-3-2
P. 158
Global Health Economics and
Sustainability
Vaccine hesitancy in the US, India, and China
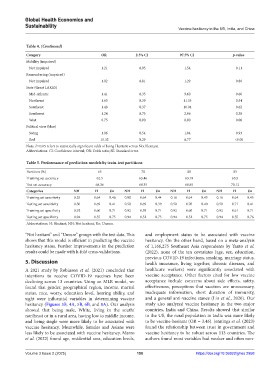
Table 4. (Continued)
Category OR 2.5% CI 97.5% CI p‑value
Mobility (impaired)
Not impaired 1.21 0.95 1.54 0.11
Remembering (impaired)
Not impaired 1.02 0.81 1.29 0.80
State (Great LAKES)
Mid-Atlantic 1.41 0.35 9.60 0.66
Northeast 1.63 0.39 11.33 0.54
Southeast 1.48 0.37 10.04 0.62
Southwest 1.24 0.75 2.06 0.38
West 0.75 0.00 0.00 0.08
Political view (blue)
Swing 1.06 0.54 1.04 0.93
Red 15.32 0.29 6.77 <0.00
Note: P<0.05 refers to statistically significant odds of being Hesitant versus Not Hesitant.
Abbreviations: CI: Confidence interval; OR: Odds ratio; SE: Standard error.
Table 5. Performance of prediction models by train‑test partitions
Partition (%) 65 70 80 85
Training set accuracy 62.5 63.46 63.19 63.5
Test set accuracy 68.36 68.35 68.85 70.12
Categories NH H Un NH H Un NH H Un NH H Un
Training set sensitivity 0.25 0.64 0.46 0.00 0.64 0.44 0.16 0.64 0.43 0.16 0.64 0.45
Testing set sensitivity 0.50 0.69 0.41 0.50 0.69 0.39 0.50 0.70 0.40 0.50 0.71 0.41
Training set specificity 0.92 0.60 0.71 0.92 0.59 0.71 0.92 0.60 0.71 0.92 0.61 0.71
Testing set specificity 0.94 0.55 0.75 0.94 0.52 0.75 0.94 0.52 0.75 0.94 0.55 0.76
Abbreviations: H: Hesitant; NH: Not hesitant; Un: Unsure.
“Not hesitant” and “Unsure” groups with the test data. This and employment status to be associated with vaccine
shows that this model is efficient in predicting the vaccine hesitancy. On the other hand, based on a meta-analysis
hesitancy status. Further improvements in the prediction of 1,166,275 Southeast Asia respondents by Yanto et al.
results could be made with k-fold cross-validations. (2022), none of the ten covariates (age, sex, education,
previous COVID-19 infections, smoking, marriage status,
5. Discussion health insurance, living together, chronic diseases, and
A 2021 study by Robinson et al. (2021) concluded that healthcare workers) were significantly associated with
intentions to receive COVID-19 vaccines have been vaccine acceptance. Other factors cited for low vaccine
declining across 13 countries. Using an MLR model, we acceptance include concerns about side effects, safety,
found that gender, geographical region, income, marital effectiveness, perceptions that vaccines are unnecessary,
status, race, worry, education level, hearing ability, and inadequate information, short duration of immunity,
sight were influential variables in determining vaccine and a general anti-vaccine stance (Lin et al., 2020). Our
hesitancy (Figures 3B, 4A, 5B, 6B, and 8A). Our analysis study also analyzed vaccine hesitancy in the two major
showed that being male, White, living in the south/ countries, India and China. Results showed that similar
northeast or in a rural area, having low to middle income, to the US, the rural population in India was more likely
and being single were more likely to be associated with to be vaccine-hesitant (OR = 3.46). Jennings et al. (2023)
vaccine hesitancy. Meanwhile, females and Asians were found the relationship between trust in government and
less likely to be associated with vaccine hesitancy. Marzo vaccine hesitancy to be robust across 113 countries. The
et al. (2022) found age, residential area, education levels, authors found most variables had weaker and often non-
Volume 3 Issue 2 (2025) 150 https://doi.org/10.36922/ghes.2958