
Page 156 - GHES-3-2
P. 156
Global Health Economics and
Sustainability
Vaccine hesitancy in the US, India, and China
Table 3. (Continued)
Category Hesitant versus not hesitant Unsure versus not hesitant Overall
OR SE 2.5% CI 97.5% CI p‑value OR SE 2.5% CI 97.5% CI p‑value p‑value_all
Mobility (impaired)
Not impaired 0.78 −1.9 0.61 1.01 0.06 0.89 −1.47 0.76 1.04 0.14 0.0084
Remembering (impaired)
Not impaired 0.96 −0.36 0.75 1.22 0.72 0.96 −0.55 0.83 1.11 0.58 0.4176
State (Great Lakes)
Mid-Atlantic 1.14 0.37 0.58 2.23 0.71 1.06 0.31 0.74 1.52 0.75 0.5325
Northeast 0.86 −0.39 0.41 1.81 0.7 0.75 −1.41 0.51 1.12 0.16 0.112
Southeast 0.99 −0.03 0.51 1.92 0.98 0.86 −0.82 0.6 1.23 0.41 0.4018
Southwest 1.28 0.51 0.5 3.28 0.61 1.19 0.67 0.72 1.95 0.5 0.305
West 1.79 1.13 0.66 4.86 0.26 1.64 1.81 0.96 2.81 0.07 0.0182
Political views (blue)
Red/blue (swing states) 1.35 1.76 0.97 1.88 0.08 1.05 0.45 0.86 1.27 0.65 0.052
Red 0.84 −0.22 0.19 3.79 0.82 0.67 −0.99 0.31 1.48 0.32 0.2624
Notes: P<0.05 indicate the differences between Hesitant versus not Hesitant, and also between Unsure and Not Hesitant groups. In addition, P<0.05
also refers to the overall comparisons among the three groups in the last column of the table.
Abbreviations: CI: Confidence interval; OR: Odds ratio; SE: Standard error.
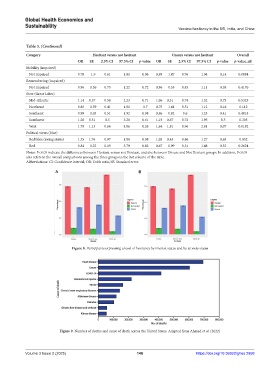
A B
Figure 8. Participants expressing a level of hesitancy by interest status and by anxiety status
Figure 9. Number of deaths and cause of death across the United States. Adapted from Ahmad et al. (2022)
Volume 3 Issue 2 (2025) 148 https://doi.org/10.36922/ghes.2958