
Page 152 - GHES-3-2
P. 152
Global Health Economics and
Sustainability
Vaccine hesitancy in the US, India, and China
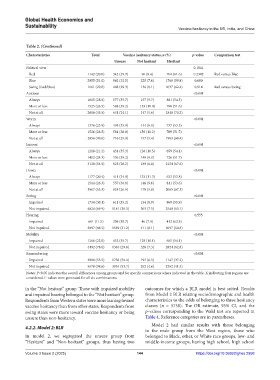
Table 2. (Continued)
Characteristics Total Vaccine hesitancy status, n (%) p‑value Comparison test
Unsure Not hesitant Hesitant
Political view 0.1841
Red 1142 (20.0) 342 (29.9) 96 (8.4) 704 (61.6) 0.2382 Red versus Blue
Blue 2955 (51.0) 962 (32.5) 225 (7.6) 1768 (59.8) 0.080
Swing (Red/blue) 1661 (29.0) 488 (29.3) 136 (8.1) 1037 (62.4) 0.914 Red versus Swing
Anxious <0.001
Always 1615 (28.0) 577 (35.7) 157 (9.7) 881 (54.5)
More or less 1525 (26.5) 584 (38.2) 153 (10.0) 788 (51.6)
Not at all 2618 (45.5) 631 (24.1) 147 (5.6) 1840 (70.2)
Worry <0.001
Always 1376 (23.9) 495 (35.9) 144 (0.0) 737 (53.5)
More or less 1526 (26.5) 581 (38.0) 156 (10.2) 789 (51.7)
Not at all 2856 (49.6) 716 (25.0) 157 (5.4) 1983 (69.4)
Interest <0.001
Always 1218 (21.2) 431 (35.3) 128 (10.5) 659 (54.1)
More or less 1402 (24.3) 536 (38.2) 140 (9.9) 726 (51.7)
Not at all 3138 (54.5) 825 (26.2) 189 (6.0) 2124 (67.6)
Down <0.001
Always 1177 (20.4) 411 (34.9) 133 (11.3) 633 (53.8)
More or less 1514 (26.3) 557 (36.8) 146 (9.6) 811 (53.6)
Not at all 3067 (53.3) 824 (26.9) 178 (5.8) 2065 (67.3)
Seeing <0.001
Impaired 1734 (30.1) 611 (35.2) 154 (8.9) 969 (55.9)
Not impaired 4024 (69.9) 1181 (29.3) 303 (7.5) 2540 (63.1)
Hearing 0.555
Impaired 661 (11.5) 203 (30.7) 46 (7.0) 412 (62.3)
Not impaired 5097 (88.5) 1589 (31.2) 411 (8.1) 3097 (60.8)
Mobility <0.001
Impaired 1266 (22.0) 452 (35.7) 129 (10.1) 685 (54.1)
Not impaired 4492 (78.0) 1340 (29.8) 328 (7.3) 2824 (62.8)
Remembering <0.001
Impaired 3080 (53.5) 1738 (56.4) 195 (6.3) 1147 (37.2)
Not impaired 5678 (98.6) 3054 (53.7) 262 (4.6) 2362 (41.5)
Notes: P<0.05 indicates the overall differences among groups and for specific comparisons where indicated in the table. X indicating four regions are
considered. P-values were generated for all six combinations.
in the “Not hesitant” group. Those with impaired mobility outcomes for which a BLR model is best suited. Results
and impaired hearing belonged to the “Not hesitant” group. from Model 2 BLR relating sociodemographic and health
Respondents from Western states were more leaning toward characteristics to the odds of belonging to three hesitancy
vaccine hesitancy than from other states. Respondents from classes (n = 5758). The OR estimate, 95% CI, and the
swing states were more toward vaccine hesitancy or being p-values corresponding to the Wald test are reported in
unsure than non-hesitancy. Table 4. Reference categories are in parentheses.
Model 2 had similar results with those belonging
4.2.2. Model 2: BLR
to the male group from the West region, those who
In model 2, we segregated the unsure group from belonged to Black, other, or White race groups, low- and
“Hesitant” and “Non-hesitant” groups, thus having two middle-income groups, having high school, high school
Volume 3 Issue 2 (2025) 144 https://doi.org/10.36922/ghes.2958