
Page 154 - GHES-3-2
P. 154
Global Health Economics and
Sustainability
Vaccine hesitancy in the US, India, and China
A B
Figure 5. Participants expressing level of hesitancy by income status
A B
Figure 6. Participants expressing a level of hesitancy by education and by hearing
4.2.3. Model 3: Training and test data
In this model, the data were partitioned having n1% of data
as the training set and n2% = 1−n1% as the test set. The
accuracy, sensitivity, specificity, and model performance
are given in Table 5. With 85% of data reserved for the
training set and the rest for the test set, the model has the
highest accuracy of 63.5% in the training set and 70.12% in
the test set. The same variables were significant as that of the
full model of the MLR. The prediction of vaccine hesitancy
using the MLR model is explained here. The model predicted
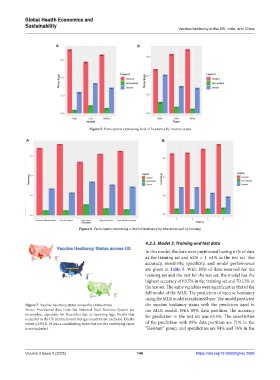
Figure 7. Vaccine hesitancy status across the Unites States the vaccine hesitancy status with the predictors used in
Notes: Provisional data from the National Vital Statistics System are the MLR model. With 85% data partition, the accuracy
incomplete, especially for December due to reporting lags. Deaths that for prediction in the test set was 63.5%. The sensitivities
occurred in the US territories and foreign countries are excluded. Deaths
where COVID-19 was a contributing factor but not the underlying cause of the prediction with 85% data partition are 71% in the
is not included. “Hesitant” group, and specificities are 94% and 76% in the
Volume 3 Issue 2 (2025) 146 https://doi.org/10.36922/ghes.2958