
Page 155 - GHES-3-2
P. 155
Global Health Economics and
Sustainability
Vaccine hesitancy in the US, India, and China
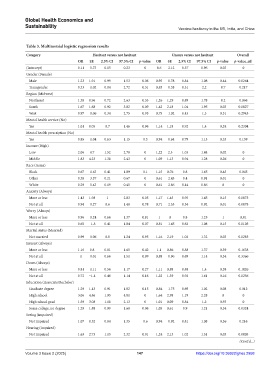
Table 3. Multinomial logistic regression results
Category Hesitant versus not hesitant Unsure versus not hesitant Overall
OR SE 2.5% CI 97.5% CI p‑value OR SE 2.5% CI 97.5% CI p‑value p‑value_all
(Intercept) 0.11 −5.73 0.05 0.23 0 0.6 −2.12 0.37 0.96 0.03 0
Gender (Female)
Male 1.23 1.91 0.99 1.53 0.06 0.95 −0.78 0.84 1.08 0.44 0.0264
Transgender 0.33 −1.02 0.04 2.72 0.31 0.83 −0.38 0.31 2.2 0.7 0.217
Region (Midwest)
Northeast 1.38 0.96 0.72 2.63 0.33 1.26 1.29 0.89 1.78 0.2 0.066
South 1.67 1.68 0.92 3.02 0.09 1.42 2.18 1.04 1.95 0.03 0.0027
West 0.97 −0.06 0.34 2.75 0.95 0.75 −1.02 0.43 1.3 0.31 0.2945
Mental health service (No)
Yes 1.01 0.05 0.7 1.46 0.96 1.14 1.18 0.92 1.4 0.24 0.2304
Mental health prescription (No)
Yes 0.85 −1.04 0.63 1.15 0.3 0.94 −0.64 0.79 1.13 0.53 0.159
Income (High)
Low 2.06 4.7 1.52 2.78 0 1.22 2.3 1.03 1.44 0.02 0
Middle 1.83 4.23 1.38 2.43 0 1.09 1.13 0.94 1.28 0.26 0
Race (Asian)
Black 0.67 −1.63 0.41 1.09 0.1 1.15 0.76 0.8 1.65 0.45 0.045
Other 0.38 −3.37 0.21 0.67 0 0.61 −2.43 0.4 0.91 0.01 0
White 0.29 −5.43 0.19 0.45 0 0.61 −2.86 0.44 0.86 0 0
Anxiety (Always)
More or less 1.43 1.98 1 2.03 0.05 1.17 1.45 0.95 1.45 0.15 0.0075
Not at all 0.94 −0.27 0.6 1.48 0.78 0.71 −2.53 0.54 0.92 0.01 0.0078
Worry (Always)
More or less 0.96 −0.24 0.66 1.37 0.81 1 0 0.8 1.25 1 0.81
Not at all 0.65 −1.8 0.41 1.04 0.07 0.81 −1.45 0.62 1.08 0.15 0.0105
Marital status (Married)
Not married 0.99 −0.06 0.8 1.24 0.95 1.16 2.19 1.02 1.32 0.03 0.0285
Interest (Always)
More or less 1.16 0.8 0.81 1.65 0.42 1.1 0.86 0.88 1.37 0.39 0.1638
Not at all 1 −0.01 0.66 1.51 0.99 0.88 −0.96 0.69 1.14 0.34 0.3366
Down (Always)
More or less 0.81 −1.11 0.56 1.17 0.27 1.11 0.88 0.88 1.4 0.38 0.1026
Not at all 0.72 −1.4 0.46 1.14 0.16 1.22 1.39 0.92 1.61 0.16 0.0256
Education (Associate/Bachelor)
Graduate degree 1.29 1.43 0.91 1.82 0.15 0.84 −1.75 0.69 1.02 0.08 0.012
High school 3.06 4.86 1.95 4.81 0 1.64 2.98 1.19 2.28 0 0
High school grad 1.59 3.08 1.18 2.13 0 1.01 0.09 0.84 1.2 0.93 0
Some college, no degree 1.29 1.88 0.99 1.68 0.06 1.05 0.61 0.9 1.21 0.54 0.0324
Seeing (impaired)
Not impaired 1.07 0.52 0.84 1.35 0.6 0.94 −0.92 0.81 1.08 0.36 0.216
Hearing (impaired)
Not impaired 1.63 2.73 1.15 2.32 0.01 1.24 2.13 1.02 1.51 0.03 0.0003
(Cont'd...)
Volume 3 Issue 2 (2025) 147 https://doi.org/10.36922/ghes.2958