
Page 157 - GHES-3-2
P. 157
Global Health Economics and
Sustainability
Vaccine hesitancy in the US, India, and China
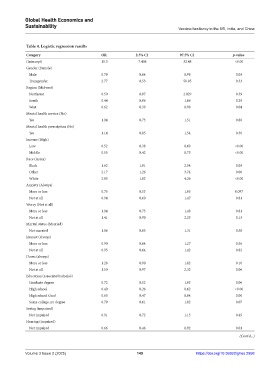
Table 4. Logistic regression results
Category OR 2.5% CI 97.5% CI p‑value
(Intercept) 15.3 7.406 32.48 <0.00
Gender (Female)
Male 0.79 0.64 0.98 0.03
Transgender 2.77 0.53 50.95 0.33
Region (Midwest)
Northeast 0.50 0.07 2.029 0.39
South 0.44 0.06 1.66 0.29
West 0.62 0.39 0.98 0.04
Mental health service (No)
Yes 1.04 0.73 1.51 0.80
Mental health prescription (No)
Yes 1.14 0.85 1.54 0.36
Income (High)
Low 0.52 0.38 0.69 <0.00
Middle 0.55 0.42 0.73 <0.00
Race (Asian)
Black 1.62 1.01 2.54 0.03
Other 2.17 1.26 3.74 0.00
White 2.83 1.83 4.26 <0.00
Anxiety (Always)
More or less 0.75 0.53 1.05 0.097
Not at all 0.94 0.60 1.47 0.81
Worry (Not at all)
More or less 1.04 0.73 1.48 0.81
Not at all 1.41 0.90 2.23 0.13
Marital status (Married)
Not married 1.06 0.85 1.31 0.58
Interest (always)
More or less 0.90 0.64 1.27 0.56
Not at all 0.95 0.64 1.42 0.82
Down (always)
More or less 1.28 0.90 1.82 0.16
Not at all 1.50 0.97 2.32 0.06
Education (associate/bachelo’s)
Graduate degree 0.72 0.52 1.03 0.06
High school 0.40 0.26 0.62 <0.00
High school Grad 0.63 0.47 0.84 0.00
Some college, no degree 0.79 0.61 1.02 0.07
Seeing (impaired)
Not impaired 0.91 0.72 1.15 0.45
Hearing (impaired)
Not impaired 0.66 0.46 0.92 0.01
(Cont'd...)
Volume 3 Issue 2 (2025) 149 https://doi.org/10.36922/ghes.2958