
Page 151 - GHES-3-2
P. 151
Global Health Economics and
Sustainability
Vaccine hesitancy in the US, India, and China
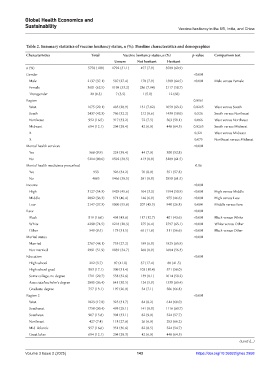
Table 2. Summary statistics of vaccine hesitancy status, n (%): Baseline characteristics and demographics
Characteristics Total Vaccine hesitancy status, n (%) p‑value Comparison test
Unsure Not hesitant Hesitant
n (%) 5758 (100) 1792 (31.1) 457 (7.9) 3509 (60.9)
Gender <0.001
Male 2137 (37.1) 587 (27.4) 170 (7.9) 1380 (64.5) <0.001 Male versus Female
Female 3601 (62.5) 1198 (33.2) 286 (7.94) 2117 (58.7)
Transgender 20 (0.3) 7 (3.5) 1 (5.0) 12 (60)
Region 0.0161
West 1675 (29.1) 485 (28.9) 131 (7.82) 1059 (63.2) 0.0265 West versus South
South 2437 (42.3) 786 (32.2) 212 (8.6) 1439 (59.0) 0.526 South versus Northeast
Northeast 952 (16.5) 317 (33.2) 72 (7.5) 563 (59.1) 0.066 West versus Northeast
Midwest 694 (12.1) 204 (29.4) 42 (6.0) 448 (64.5) 0.0265 South versus Midwest
X 0.321 West versus Midwest
X 0.075 Northeast versus Midwest
Mental health services <0.001
Yes 568 (9.9) 224 (39.4) 44 (7.0) 300 (52.8)
No 5214 (90.6) 1592 (30.5) 413 (8.0) 3209 (61.5)
Mental health medicines prescribed 0.06
Yes 953 326 (34.2) 76 (8.0) 551 (57.8)
No 4805 1466 (30.5) 381 (8.0) 2958 (61.5)
Income <0.001
High 3127 (54.3) 1429 (45.6) 104 (3.3) 1594 (50.9) <0.001 High versus Middle
Middle 2092 (36.3) 971 (46.4) 146 (6.9) 975 (46.6) <0.001 High versus Low
Low 2147 (37.3) 1000 (55.8) 207 (45.3) 940 (26.8) 0.004 Middle versus Low
Race <0.001
Black 919 (16.0) 401 (43.6) 117 (12.7) 401 (43.6) <0.001 Black versus White
White 4290 (74.5) 1218 (28.3) 275 (6.4) 2797 (65.1) <0.001 White versus Other
Other 549 (9.5) 173 (31.5) 65 (11.8) 311 (56.6) <0.001 Black versus Other
Marital status <0.001
Married 2767 (48.1) 753 (27.2) 189 (6.0) 1825 (65.9)
Not married 2991 (51.9) 1039 (34.7) 268 (8.9) 1684 (56.3)
Education <0.001
High school 212 (3.7) 87 (41.0) 37 (17.4) 88 (41.5)
High school grad 983 (17.1) 309 (31.4) 103 (10.4) 571 (58.0)
Some college, no degree 1711 (29.7) 558 (32.6) 139 (8.1) 1014 (59.2)
Associate/bachelor’s degree 2095 (36.4) 641 (30.5) 124 (5.9) 1330 (63.4)
Graduate degree 757 (13.1) 197 (26.0) 54 (7.1) 506 (66.8)
Region 2 <0.001
West 1023 (17.8) 325 (31.7) 84 (8.2) 614 (60.0)
Southwest 1750 (30.4) 493 (28.1) 141 (8.0) 1116 (63.7)
Southeast 907 (15.8) 301 (33.1) 82 (9.0) 524 (57.7)
Northeast 427 (7.4) 118 (27.6) 26 (6.0) 283 (66.2)
Mid-Atlantic 957 (16.6) 351 (36.6) 82 (8.5) 524 (54.7)
Great lakes 694 (12.1) 204 (29.3) 42 (6.0) 448 (64.5)
(Cont'd...)
Volume 3 Issue 2 (2025) 143 https://doi.org/10.36922/ghes.2958