
Page 147 - GHES-3-2
P. 147
Global Health Economics and
Sustainability
Vaccine hesitancy in the US, India, and China
(i) What is the level of vaccine hesitancy among the three BLR. The theory behind MLR includes the following key
largest countries by population size: the US, India, and components:
China?
(ii) What factors are associated with vaccine hesitancy in 3.1.1. Logistic regression
these countries? The MLR builds on the principles of BLR. The BLR models
(iii) How can cross-sectional and longitudinal data be the relationship between a set of predictor variables and
utilized to study vaccine hesitancy? a binary outcome variable. It uses the logistic function
(iv) Which subgroups require further research on vaccine to estimate the probability of the outcome being in one
hesitancy? category versus the other. In MLR, this concept is extended
To address these questions, we analyze two datasets to multiple outcome categories.
on vaccine hesitancy. The first dataset is extracted from 3.1.2. Categorical outcome variable
the ICPSR COVID-19 database (https://doi.org/10.3886/
E130422V1) and includes cross-sectional survey data In MLR, the outcome variable is categorical, with three
assessing the prevalence of vaccine hesitancy in the US, or more unordered categories. Each category represents a
India, and China. The second dataset is derived from the distinct and mutually exclusive outcome. Examples could
HPS data. include predicting the choice of a political party (e.g.,
democrat, republican, and independent) or predicting the
For the ICPSR dataset, we report proportions and type of vehicle chosen (e.g., car, truck, SUV).
summary statistics to give an overview of the vaccine
hesitancy global picture. The HPS dataset was analyzed 3.1.3. Logits and log odds
using multinomial and binary logistic regression. When The probabilities of each category are modeled as the log
the response or outcome can be categorized into two odds (logit) of being in that category (Equations I and II).
classes, such as “Hesitant” and “Not hesitant,” and with The log odds represent the natural logarithm of the ratio
several explanatory variables, then a BLR is commonly of the probability of being in a specific category to the
used. If there are more than two categories, then a natural probability of being in a reference category. The reference
extension of BLR is MLR. Individual Chi-square tests category is one of the categories used as the baseline for
of independence between vaccine hesitancy and health comparison.
categories and exploratory data analysis supplemented
and helped in our understanding of the causal factors 3.1.4. Parameter estimation
influencing vaccine hesitancy. Rstudio (RStudio|Open
Source & Professional Software for Data Science Teams- The estimates of the parameters of an MLR model are
RStudio, n.d.) and Microsoft Excel were utilized for the obtained using maximum likelihood estimation. The goal
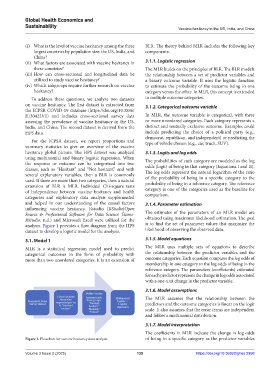
analysis. Figure 1 provides a flow diagram from the HPS is to find the set of parameter values that maximize the
dataset to develop a logistic model for the analysis. likelihood of observing the observed data.
3.1. Model 1 3.1.5. Model equations
MLR is a statistical regression model used to predict The MLR uses multiple sets of equations to describe
categorical outcomes in the form of probability with the relationship between the predictor variables and the
more than two unordered categories. It is an extension of outcome categories. Each equation compares the log odds of
membership in one category to the log odds of being in the
reference category. The parameters (coefficients) estimated
for each predictor represent the change in log odds associated
with a one-unit change in the predictor variable.
3.1.6. Model assumptions
The MLR assumes that the relationship between the
predictors and the outcome categories is linear on the logit
scale. It also assumes that the error terms are independent
and follow a multinomial distribution.
3.1.7. Model interpretation
The coefficients in MLR indicate the change in log odds
Figure 1. Flowchart for vaccine hesitancy data analysis of being in a specific category as the predictor variables
Volume 3 Issue 2 (2025) 139 https://doi.org/10.36922/ghes.2958