Page 30 - GPD-2-3
P. 30

Gene & Protein in Disease                                           Signatures construction strategies for TC


                                                               respectively estimated to define  each signature, taking
                                                               BRAFV600E mutation into account. Thus, K-M survival
                                                               analysis showed that patients with high glycolysis or GLUT
                                                               scores possessed a worse prognosis in PDTC/ATC .
                                                                                                       [50]
                                                               3.3.4.2. Signatures related to alternative splicing events
                                                               As  reported,  splicing  events  significantly  influence
                                                               the  occurrence  of  cancer [71-74] .  Lin  et al.  obtained  data
                                                               from 496  patients with AS profiles derived from TCGA
                                                               SpliceSeq and clinical data. Lasso regression analysis was
                                                               performed to develop seven types (alternate acceptor site
                                                               [AA], alternate promoter [AP], alternate terminator [AT],
                                                               alternate donor site [AD], exon skip [ES], retained intron
                                                               [RI], and mutually exclusive exons [ME]) of splicing events.
                                                               Moreover, 20 alternative splicing (AS) events were screened
                                                               to recognize the most significant prognostic signature. This
                                                               signature was then verified as an independent predictor
                                                               by the ROC curve (AUC value is 0.843) and multivariate
                                                               analysis . Furthermore, Han et al. have also concerned
                                                                     [52]
                                                               with the pivotal role of the alternative splicing events in
                                                               TC prognosis and built a prediction model including
                                                               AA, ES, AD, ME, and AT events with accurate prognostic
                                                               efficacy , indicating that the prognosis effect of alternative
                                                                     [51]
                                                               splicing events on TC was a promising research subject.
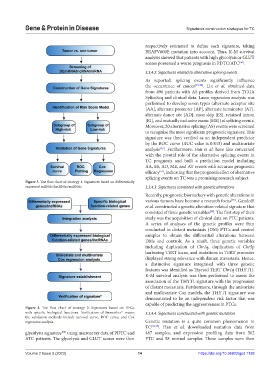
            Figure 3. The flow chart of strategy 1: Signatures based on differentially
            expressed mRNAs/lncRNAs/miRNAs                     3.3.4.3. Signatures correlated with genetic alterations
                                                               Recently, prognostic biomarkers with genetic alterations in
                                                               various tumors have become a research focus . Gandolfi
                                                                                                   [75]
                                                               et al. constructed a genetic alteration-related signature that
                                                                                          [54]
                                                               consisted of three genetic variables . The first step of their
                                                               study was the acquisition of clinical data on PTC patients.
                                                               A  series of analyses of the genetic profiles were then
                                                               conducted in distant metastasis (DM) PTCs and control
                                                               samples  to  obtain the  differential alterations  between
                                                               DMs and controls. As a result, three genetic variables
                                                               including  duplication of  Chr1q, duplication  of  Chr5p
                                                               harboring TERT locus, and mutations in TERT promoter
                                                               displayed strong relevance with distant metastasis. Hence,
                                                               a distinctive signature integrated with three genetic
                                                               features was identified as Thyroid TERT Chr1q (THYT1).
                                                               K-M survival analysis was then performed to assess the
                                                               association of the THYT1 signature with the progression
                                                               of distant metastasis. Furthermore, through the univariate
                                                               and multivariate Cox models, the THYT1 signature was
                                                               demonstrated to be an independent risk factor that was
                                                               capable of predicting the aggressiveness in PTCs.
            Figure  4.  The flow chart of strategy 2: Signatures based on DEGs
            with  specific  biological  functions.  Verification  of  biomarker*  means   3.3.4.4. Signatures constructed with genetic mutation
            the validation methods include survival curve, ROC curve, and Cox
            regression analysis.                               Genetic mutation is a quite common phenomenon in
                                                               TC [76,77] . Han  et al. downloaded mutation data from
            glycolysis signature  using microarray data of PDTC and   487  samples, and expression profiling data from 502
                           [50]
            ATC patients. The glycolysis and GLUT scores were then   PTC and 58 normal samples. These samples were then

            Volume 2 Issue 3 (2023)                         14                       https://doi.org/10.36922/gpd.1138
   25   26   27   28   29   30   31   32   33   34   35