
Page 25 - GPD-2-3
P. 25
Gene & Protein in Disease Signatures construction strategies for TC
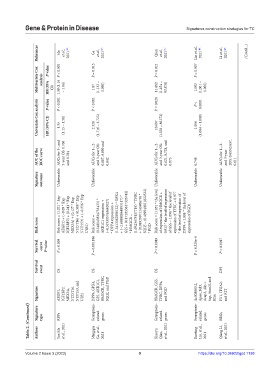
References Ma et al., 2021 [30] Ge et al., 2021 [27] Qian et al., 2021 [31] Lin et al., 2021 [46] Li et al., 2021 [45] (Cont’d...)
Multivariate Cox analysis P‑value HR (95% CI) P < 0.001 1.38 (1.16 – 1.64) P = 0.015 1.87 (1.132 – 3.090) P = 0.021 11.682 (1.454 – 93.878) P = 0.007 1.003 (1.001 – 1.005)
Univariate Cox analysis P‑value HR (95% CI) P < 0.001 1.35 (1.15 – 1.58) P < 0.001 2.528 (1.716 – 3.725) P = 0.026 10.697 (1.328 – 86.173) P < 1.006 0.0001 (1.004 – 1.008)
AUC of the ROC curve AUCs for 3-, and 5-year OS: 0.766 and 0.784 AUCs for 1-, 2- and 3-year OS: 0.887, 0.890 and 0.842 AUCs for 1-, 2- and 3-year OS: 0.621, 0.728, and 0.875 0.748 AUCs for 1-, 2- and 3-year DFS: 0.659,0.637, 0.611
Signature outcome Unfavorable Unfavorable Unfavorable Unfavorable Unfavorable
Risk score = (1.021 * Exp AZGP1) + (−0.09 * Exp IGF2BP2) + (0.241 * Exp MEX3A) + (0.127 * Exp NUDT16) + (0.388 * Exp NUP153) + (−0.236 * Exp (0.340143834733433) * AKR1C1 expression + (−0.319305763663027) * DPP4 expression + (1.3413362890122) * GPX4 + (−2.69880844893117) * GSS + (0.171053637326744) (1.0923479137719) * TFRC + (0.0892997114590679) * SQLE + (0.499540011822522) Risk score = (1.051 * the level of expressi
Risk score USB1) Risk score = * HMGCR + * PGD
Survival curve P‑value P = 0.009 P = 0.001186 P = 0.0049 P = 6.329e-4 P = 0.0017
Survival event OS OS OS DFS
Signature AZGP1, IGF2BP2, MEX3A, NUDT16, NUP153, and USB1 DPP4, GPX4, GSS, AKR1C1, HMGCR, TFRC, SQLE, and PGD HMGCR, GSS, TFRC, DPP4, and PGD Ac008063.2, Apoe, Bcl3, Acap3, Alo × 5ap, Atxn2l, and B2m FN1, ITGA2, and KIT
Table 2. (Continued) Signature Authors type RBPs Yue Ma et al., 2021 Ferroptosis- Mingqin related Ge, et al., genes 2021 Ferroptosis- Xiaoyu related Qian, genes et al., 2021 Ferroptosis- Ruoting related Lin, et al., genes 2021 ERGs Qiang Li, et al., 2021
Volume 2 Issue 3 (2023) 9 https://doi.org/10.36922/gpd.1138