
Page 20 - GPD-2-3
P. 20
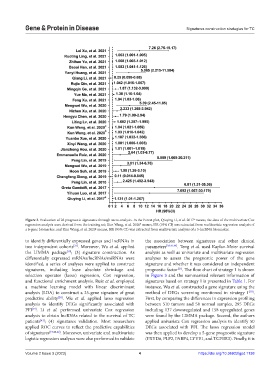
Gene & Protein in Disease                                           Signatures construction strategies for TC


            Figure 2. Evaluation of 28 prognostic signatures through meta-analysis. In the Forest plot, Qiuying Li, et al. 2017  means, the data of the multivariate Cox
                                                                                   a
            regression analysis were derived from the training set; Kun Wang, et al. 2020  means, HR (95% CI) was extracted from multivariate regression analysis of
                                                             b
            a 6-gene biomarker; and Kun Wang, et al. 2020  means, HR (95% CI) was extracted from multivariate analysis of a 5-lncRNA biomarker.
                                          c
            to identify differentially expressed genes and lncRNAs in   the association between signatures and other clinical
            two independent cohorts . Moreover, Wu et al. applied   parameters [33,41,44] . Teng et al. used Kaplan-Meier survival
                                [21]
            the LIMMA package ; (3) signature construction. As   analysis as well as univariate and multivariate regression
                             [19]
            differentially expressed mRNAs/lncRNAs/miRNAs were   analyses to assess the prognostic power of the gene
            identified, a series of analyses were applied to construct   signature and whether it was considered an independent
            signatures, including lease absolute shrinkage and   prognostic factor . The flow chart of strategy 1 is shown
                                                                             [21]
            selection  operator  (lasso)  regression,  Cox  regression,   in Figure 3 and the summarized relevant information of
            and functional enrichment analysis. Ruiz et al. employed   signatures based on strategy 1 is presented in Table 1. For
            a  machine learning model with  linear  discriminant   instance, Wu et al. constructed a gene signature using the
            analysis (LDA) to construct a 25-gene signature of great   method of DEGs screening mentioned in strategy 1 .
                                                                                                           [19]
            predictive ability . Wu  et al. applied lasso regression   First, by comparing the differences in expression profiling
                          [20]
            analysis to identify DEGs significantly associated with   between 510 tumors and 58 normal samples, 295 DEGs
            PFI . Li  et al. performed univariate Cox regression   including 137 downregulated and 158 upregulated genes
               [19]
            analysis to obtain lncRNAs related to the survival of TC   were found by the LIMMA package. Second, the authors
            patients ; (4) signatures validation. Most researchers   applied univariate Cox regression analysis to identify 50
                  [41]
            applied ROC curves to reflect the predictive capabilities   DEGs associated with PFI. The lasso regression model
            of signatures [19,20,42] . Moreover, univariate and multivariate   was then applied to develop a 5-gene prognostic signature
            logistic regression analyses were also performed to validate   (FXYD6, PLP2, FABP4, LYVE1, and TGFBR3). Finally, it is


            Volume 2 Issue 3 (2023)                         4                        https://doi.org/10.36922/gpd.1138