
Page 23 - GPD-2-3
P. 23
Gene & Protein in Disease Signatures construction strategies for TC
essential to verify the prognostic effect of this signature. By
calculating the risk score and determining the cutoff value,
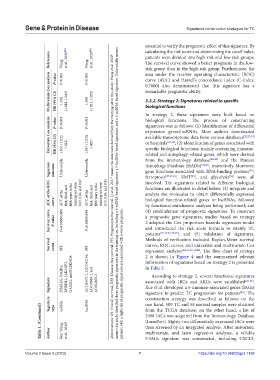
References Wang et al., 2020 [66] Wang et al., 2020 [66] patients were divided into high-risk and low-risk groups.
The survival curve showed a better prognosis in the low-
risk group than in the high-risk group. Furthermore, the
area under the receiver operating characteristic (ROC)
Multivariate Cox analysis P‑value HR (95% CI) P<0.001 1.030 (1.018, 1.042) P<0.001 1.040 (1.021, 1.059) curve (AUC) and Harrell’s concordance index (C-index;
0.7600) also demonstrated that this signature has a
remarkable prognostic ability.
3.3.2. Strategy 2: Signatures related to specific
biological functions
In strategy 2, these signatures were built based on
P<0.001
Univariate Cox analysis HR (95% CI) 1.032 (1.022, 1.042) 1.047 (1.030, 1.065) signatures was as follows: (1) Identification of differential
P<0.001
P‑value
biological functions. The process of constructing
expression genes/lncRNAs. Most authors downloaded
available transcriptome data from various databases
[22,23,30]
or hospitals
; (2) identification of genes associated with
[27,32]
specific biological functions, mainly containing immune-
from the immunology database
and the Human
[24-26]
Signature outcome Unfavorable Unfavorable related and autophagy-related genes, which were derived
, respectively. Moreover,
[22,23]
Autophagy Database (HADb)
[30]
gene functions associated with RNA-binding proteins ,
, EMT , and glycolysis were all
[45]
[32]
ferroptosis
[27,31,46]
AUC of the ROC curve AUC of the first, third, and fifth years in the training set were 0.83, 0.82, and 0.82 AUC of the first, third, and fifth years in the training set were 0.75, 0.84, and 0.85 Abbreviations: OS: Overall survival; DFS: Disease-free survival; PFI: Progression-free interval. Li et al. 2017 a means the data were derived from the training set in this study; Wang et al. 2020 b means this study identified three prog
functions are illustrated in detail below; (3) integrate and
analyze the molecules to obtain differentially expressed
biological function-related genes or lncRNAs, followed
by functional enrichment analyses being performed; and
Survival curve P‑value P=0.000002462 P=0.00005696 (4) establishment of prognostic signatures. To construct
a prognostic gene signatures, studies based on strategy
2 adopted the Cox proportion hazards regression model
and introduced the risk score formula to stratify TC
patients [22-27,30-32,45] ; and (5) validation of signatures.
Survival event PFI PFI Methods of verification included Kaplan-Meier survival
curves, ROC curves, and univariate and multivariate Cox
. The flow chart of strategy
regression analyses
[24-27,30-32,46]
2 is shown in Figure 4 and the summarized relevant
information of signatures based on strategy 2 is presented
According to strategy 2, several functional signatures
Signature PIMREG, PAQR4, RHBDL1, JAKMIP3, GAS2L2, and PLEKHG4 AC136475.1, LINC02154, AC010969.1, and AC064805.2 patients with a high risk of prognostic signatures are associated with a worse prognosis. in Table 2. [26] [22-26] .
associated with IRGs and ARGs were established
Xue et al. developed a 5-immune-associated genes (IAGs)
signature to predict TC progression for patients . The
construction strategy was described as follows: on the
Table 1. (Continued) Signature Author type mRNA Kun Wang, et al., 2020 b lncRNA one hand, 509 TC and 58 normal samples were obtained
from the TCGA database; on the other hand, a list of
2498 IAGs was acquired from the Immunology Database
(ImmPort). Eighty-two differentially expressed IAGs were
then screened by an integrated analysis. After univariate,
multivariate, and lasso regression analyses, a reliable
Volume 2 Issue 3 (2023) 7 5-IAGs signature was constructed, including CXCL5,
https://doi.org/10.36922/gpd.1138