
Page 24 - GPD-2-3
P. 24
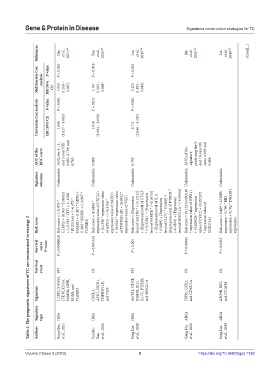
Gene & Protein in Disease                                           Signatures construction strategies for TC


                 References  Qin   et al.,   2021 [25]  Xue   et al.,   2020 [26]  Lin   et al.,   2019 [24]  Hu   et al.,   2020 [22]  Lin   et al.,   2018 [23]  (Cont’d...)


                 Multivariate Cox   analysis  P‑value  HR (95%   CI)  P = 0.001  1.042   (1.016 –   1.067)  P = 0.016  1.187   (1.032 –   1.366)  P < 0.001  2.425   (1.492 –   3.943)


                 Univariate Cox analysis  P‑value HR (95% CI)  P < 0.001  1.046   (1.027 – 1.065)  P = 0.011  1.018   (1.004 – 1.033)  P < 0.001  2.711   (2.046 – 3.592)


                 AUC of the   ROC curve  AUCs for 1-, 3-,   and 5-year PFI:   0.802, 0.729, and   0.703  0.888  0.792  AUCs of the   signature   predicting the 5-   and 10-year OS   rates: 0.839 and   0.886


                 Signature   outcome  Unfavorable  Unfavorable  Unfavorable      Unfavorable   Unfavorable


                          Risk score = (−0.876 *  ULBP2) + (0.301 * S100A5)   + (−0.582 * LTF) + (−1.003   * PLXNA4) + (−0.975 *  FAM3B) + (1.901 * GIPR) +  (1.606 * RORB) + (−0.907 *   Risk score = (0.6846 *  expression value of CXCL5)  + (1.1556 * expression value   of AZU1) + (−0.3156 *   expression value of NOD1)  + (0.0542 * expression value  of TNFRSF11B) + (0.0952 *   expression value of VGF)  Risk score = [Expression  level of AGTR1 * (−0.1212)]  + [Expression lev


             Table 2. The prognostic signatures of TC are summarized in strategy 2
                 Risk score           TGFBR3)                                              CDKN2A)   expression


                 Survival   curve  P‑value  P = 0.0000026  P = 0.001524  P < 0.001  P = 0.00042  P = 0.0023


                 Survival   event  PFI   OS               PFI                    OS            OS


                 Signature  ULBP2, S100A5,   LTF, PLXNA4,   FAM3B, GIPR,   RORB, and   TGFBR3  CXCL5,   AZU1, NOD1,   TNFRSF11B,   and VGF  AGTR1, CTGF,   FAM3B, IL11,   IL17C, PTH2R,   and SPAG11A  ITPR1, CCL2,   and CDKN2A  ATG9B, BID,   and DNAJB1


                 Signature   type  IRGs  IRGs             IRGs                   ARGs          ARGs


                 Authors  Rujia Qin,   et al., 2021  Yuanbo   Xue,   et al., 2020  Peng Lin,   et al., 2019  Gang Hu,   et al., 2020  Peng Lin,   et al., 2018


            Volume 2 Issue 3 (2023)                         8                        https://doi.org/10.36922/gpd.1138