
Page 29 - GPD-2-3
P. 29
Gene & Protein in Disease Signatures construction strategies for TC
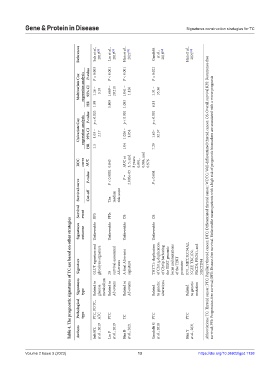
References Suh et al., 2019 [50] Lin et al., 2019 [52] Han et al., 2021 [51] Gandolfi et al., 2018 [54] Han et al., 2021 [53]
Multivariate Cox regression analysis P‑value 95% CI P = 0.003 1.26 – 3.10 P < 0.001 1.669 – 20.211 P < 0.001 1.041 – 1.126 P = 0.022 1.31 – 35.36
HR 1.98 5.809 1.083 6.81
Univariate Cox regression analysis P‑value 95% CI p = 0.033 1.03 – 2.17 p < 0.001 1.026 – 1.054 p = 0.001 1.63– 32.57
HR 1.5 1.04 7.29
ROC curve AUC 0.843 AUC at 3, 5, and 8 years: 0.991, 0.984, and 0.976
P‑value P < 0.0001 P = 2.002e-05 P = 0.001
Survival curve Cut‑off The median risk score Abbreviations: TC: Thyroid cancer; PTC: Papillary thyroid cancer; DTC: Differentiated thyroid cancer; WDTC: Well-differentiated thyroid cancer; OS: Overall survival RFS: Recurrence-free
Survival event RFS PFIs OS OS survival; PFS: Progression-free survival; DFS: Disease-free survival. Unfavorable means patients with a high risk of prognostic biomarkers are associated with a worse prognosis
Table 4. The prognostic signatures of TC are based on other strategies
Signatures outcome Unfavorable Unfavorable Unfavorable Unfavorable
GLUT signature and glycolysis signature survival-associated A final AS events THYT1: duplication of Chr1q, duplication of Chr5p harboring the TERT genomic locus and mutations FN1, MET, SLC34A2, NGEF, TBC1D2, PLCD3, PROS1, and
Signature 20 AS events signature of the TERT promoter NECTIN4
Signatures type Related to glucose metabolism Related to AS events Related to AS events Related to genetic alterations Related to genetic mutation
Pathological type PTC, PDTC, ATC PTC TC PTC PTC
Authors Suh HY, et al., 2019 Lin P et al., 2019 Han B et al., 2021 Gandolfi G et al., 2018 Han Y et al., 2021
Volume 2 Issue 3 (2023) 13 https://doi.org/10.36922/gpd.1138