
Page 44 - GPD-2-3
P. 44
Gene & Protein in Disease Effect of phytochemicals in diabetes
Table 7. ADMET and drug‑likeness prediction results of qualified compounds (OSIRIS Property Explorer and DruLiTo tools result)
Compounds PubChem CID Toxicity cLogP LogS Molecular TPSA Drug Drug BBB
Risk weight likeness score
Vindolinine CID: 24148538 G 1.7 −3.38 336 41.57 2.36 0.49 Pass
Vindoline CID: 425978 G 1.32 −3.12 456 88.54 3.95 0.74 Fail
(+)-Vindorosine CID: 261578 G 1.39 −3.1 426 79.31 3.86 0.78 Fail
Cr-1 CID: 5315746 G 0.91 −2.69 384 73.24 3.95 0.84 Pass
Cr-2 CID: 59908094 G 2.61 −4.38 482 79.31 0.58 0.5 Fail
Metformin (control drug) CID: 4091 G −1.54 −0.13 129 91.49 1.21 0.88 Pass
Abbreviations: cLogP (O/W), Logarithm of partition coefficient between n-octanol and water; LogS, aqueous solubility; TPSA, Topological polar
surface area; G, Green signal (indicated no toxicity risk).
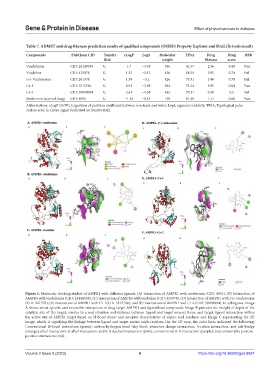
Figure 1. Molecular docking studies of AMPK1 with different ligands. (A) Interaction of AMPK1 with metformin (CID: 4091); (B) Interaction of
AMPK1 with vindolinine (CID: 24148538); (C) Interaction of AMPK1 with vindoline (CID: 425978); (D) Interaction of AMPK1 with (+)-vindorosine
(CID: 261578); (E) Interaction of AMPK1 with Cr-1(CID-5315746); and (F) Interaction of AMPK1 and Cr-2 (CID: 59908094). In subfigures, Image
A shows about specific and reversible interaction of drug target AMPK1 and ligand/lead compound; Image B provides the insight of depth of the
catalytic site of the target, similar to a real situation and distance between ligand and target around them, and target-ligand interaction within
the active site of AMPK1 target based on H-bond donor and acceptor characteristic of amino acid residues; and Image C representing the 2D
image, which is signifying the linkage between ligand and target amino acids residues. On the 2D map, the color lines indicated the following:
Conventional H-bond interaction (green); carbon-hydrogen bond (sky blue); attractive charge interaction, π-cation interaction, and salt bridge
(orange); alkyl interaction, π-alkyl interaction, and π-π stacked interaction (pink); conventional π-σ interaction (purple); and unfavorable positive-
positive interaction (red).
Volume 2 Issue 3 (2023) 6 https://doi.org/10.36922/gpd.0927