
Page 127 - GPD-3-2
P. 127
Gene & Protein in Disease Bioinformatics to identify gene signatures of CF
were determined as highly significant, with 104 and 107
identified upregulated and downregulated, respectively,
based on the threshold values (Tables S1 and S2).
3.2. Analysis of DEGs’ functionality
The GO analysis of DEGs revealed analysis outputs
concerning the top 10 enrichments utilizing the DAVID
database. Figure 3A and B demonstrate the results
of the analysis of enrichment for biological process,
cellular component, and molecular function. N-acyl
phosphatidylethanolamine-specific phospholipase D
activity and protein kinase activity are the primary
enrichments of the upregulated DEGs. In contrast,
the downregulated DEGs were significant in protein
polyubiquitination, ubiquitin-protein transferase action,
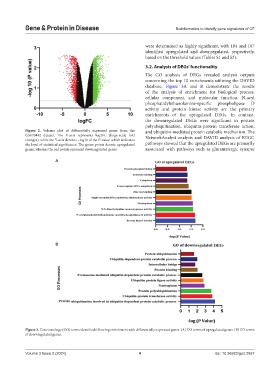
Figure 2. Volcano plot of differentially expressed genes from the and ubiquitin-mediated protein catabolic mechanism. The
GSE70442 dataset. The X-axis represents log2FC (large-scale fold NetworkAnalyst analysis and DAVID analysis of KEGG
changes), while the Y-axis denotes −log10 of the P-value, which indicates
the level of statistical significance. The green points denote upregulated pathways showed that the upregulated DEGs are primarily
genes, whereas the red points represent downregulated genes. associated with pathways such as glutamatergic synapse
A
B
Figure 3. Gene ontology (GO) terms identified following enrichment with differentially expressed genes. (A) GO terms of upregulated genes. (B) GO terms
of downregulated genes.
Volume 3 Issue 2 (2024) 4 doi: 10.36922/gpd.2937