
Page 100 - GPD-4-2
P. 100
Gene & Protein in Disease Significance of MXRA7 in bladder cancer
exosome”, “calcium ion binding”, etc. Together this, 3.3. Differential survival curves of BLCA patients
evidence suggests that MXRA7 may promote the survival, correlated with MXRA7 expression levels
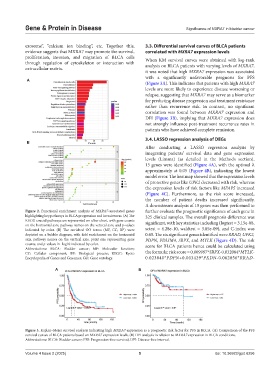
proliferation, invasion, and migration of BLCA cells When KM survival curves were obtained with log-rank
through regulation of cytoskeleton or interaction with analysis on BLCA patients with varying levels of MXRA7,
extracellular matrix.
it was noted that high MXRA7 expression was associated
with a significantly unfavorable prognosis for PFS
A
(Figure 3A). This indicates that patients with high MXRA7
levels are more likely to experience disease worsening or
relapse, suggesting that MXRA7 may serve as a biomarker
for predicting disease progression and treatment resistance
rather than recurrence risk. In contrast, no significant
correlation was found between MXRA7 expression and
DFI (Figure 3B), implying that MXRA7 expression does
not strongly influence post-treatment recurrence rates in
patients who have achieved complete remission.
3.4. LASSO regression analysis of DEGs
B
After conducting a LASSO regression analysis by
integrating patients’ survival data and gene expression
levels (Limma) (as detailed in the Methods section),
15 genes were identified (Figure 4A), with the optimal λ
approximately at 0.05 (Figure 4B), indicating the lowest
model error. The heatmap showed that the expression levels
of protective genes like UPK2 decreased with risk, whereas
the expression levels of risk factors like MFAP5 increased
(Figure 4C). Furthermore, as the risk score increased,
the number of patient deaths increased significantly.
A downstream analysis of 15 genes was then performed to
Figure 2. Functional enrichment analysis of MXRA7-associated genes further evaluate the prognostic significance of each gene in
highlighting key pathways in BLCA progression and invasiveness. (A) The 325 clinical samples. The overall prognosis difference was
KEGG crucial pathways are represented on a bar chart, with gene counts significant, with key statistics including (logtest = 3.15e-08,
on the horizontal axis, pathway names on the vertical axis, and p-values
indicated by color. (B) The enriched GO terms (MF, CC, BP) were sctest = 4.28e-10, waldtest = 3.85e-09), and C-index was
depicted on a bubble diagram, with fold enrichment on the horizontal 0.65. The six significant genes identified were RRAD, UPK2,
axis, pathway names on the vertical axis, point size representing gene PDPN, PDLIM4, SRPX, and MYLK (Figure 4D). The risk
counts, and p-values in -log10 indicated by color. score for BLCA patients hence could be calculated using
Abbreviations: BLCA: Bladder cancer; MF: Molecular function;
CC: Cellular component; BP: Biological process; KEGG: Kyoto the formula: risk score = 0.009997*SRPX-0.032084*MYLK-
Encyclopedia of Genes and Genomes; GO: Gene ontology. 0.023840*PDPN+0.003429*PXDN-0.062056*RRAD-
A B
Figure 3. Kaplan–Meier survival analysis indicating high MXRA7 expression as a prognostic risk factor for PFS in BLCA. (A) Comparison of the PFS
survival curves of BLCA patients based on MXRA7 expression levels. (B) DFI analysis in relation to MXRA7 expression in BLCA conditions.
Abbreviations: BLCA: Bladder cancer; PFS: Progression-free survival; DFI: Disease-free interval.
Volume 4 Issue 2 (2025) 5 doi: 10.36922/gpd.6256