
Page 111 - GPD-4-2
P. 111
Gene & Protein in Disease Pediatric glioma circadian clock genes
A
B
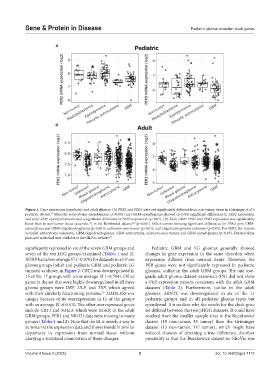
Figure 1. Gene expression in pediatric and adult gliomas. (A) PER2 and PER3 were not significantly different from non-tumor tissue in Griesinger et al.’s
pediatric dataset. Pilocytic astrocytoma-ependymoma (p<0.001) and GBM-ependymoma showed (p<0.01) significant differences in PER2 expression,
37
and only GBM-ependymoma showed a significant difference in PER3 expression (p<0.05). (B) Adult GBM PER2 and PER3 expression was significantly
lower than in non-tumor tissue (asterisks *) in the Rembrandt dataset (p<0.001). Other tumors showing significant differences for PER2 were GBM-
40
astrocytoma and GBM-oligodendroglioma (p<0.001); unknown-non-tumor (p<0.01); and oligodendroglioma-unknown (p<0.05). For PER3, the tumors
included astrocytoma-unknown, GBM-oligodendroglioma, GBM-astrocytoma, unknown-non-tumor, and GBM-mixed glioma (p<0.05). Derived from
plots and statistical tests available at the GlioVis website. 27
significantly repressed in six of the seven GBM groups and Pediatric GBM and LG gliomas generally showed
seven of the ten LGG groups examined (Tables 1 and 2). changes in gene expression in the same direction when
RORB had a low average EI (−0.870) for datasets in all three expression differed from normal tissue. However, the
glioma groups (adult and pediatric GBM and pediatric LG PER genes were not significantly repressed in pediatric
tumors) as shown in Figure 2. CRY2 was downregulated in gliomas, unlike in the adult GBM groups. The one low-
15 of the 17 groups with a low average EI (−0.794). Other grade adult glioma dataset examined (PA) did not show
genes in the set that were highly downregulated in all three a PER expression pattern consistent with the adult GBM
glioma groups were DBP, HLF, and TEF, which agreed datasets (Table 2). Furthermore, unlike in the adult
with their similarly functioning proteins. TIMELESS was gliomas, ARNTL was downregulated in six of the 11
55
unique because of its overexpression in 11 of the groups pediatric groups and in all pediatric glioma types but
with an average EI of 0.610. The other overexpressed genes ependymal. It is unclear why the results for the clock gene
include CRY1 and NFIL3, which were mostly in the adult set differed between the two pHGG datasets. It could have
GBM groups; PER1 and NR1D1 data were missing in many resulted from the smaller sample sizes in the Buczkowicz
groups (Tables 1 and 2). Note that the EI is merely a way to dataset (19 non-tumor, 35 tumor) than the Griesinger
summarize the expression data and shows trends in similar dataset (13 non-tumor, 117 tumor), which might have
departures in expression from normal tissue without reduced chances of detecting a true difference. Another
carrying a statistical connotation of these changes. possibility is that the Buczkowicz dataset in GlioVis was
Volume 4 Issue 2 (2025) 5 doi: 10.36922/gpd.4112