
Page 115 - GPD-4-2
P. 115
Gene & Protein in Disease Pediatric glioma circadian clock genes
A B
D
C
E F
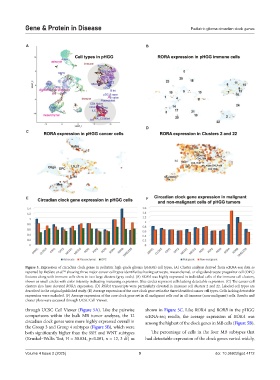
Figure 3. Expression of circadian clock genes in pediatric high-grade glioma (pHGG) cell types. (A) Cluster analysis derived from scRNA-seq data as
reported by DeSisto et al. showing three major cancer cell types identified as having astrocyte, mesenchymal, or oligodendrocyte progenitor cell (OPC)
50,
features along with immune cells show in two large clusters (gray ovals). (B) RORA was highly expressed in individual cells of the immune cell clusters,
shown as small circles with color intensity indicating increasing expression. Blue circles represent cells lacking detectable expression. (C) The cancer cell
clusters also have elevated RORA expression. (D) RORA transcripts were particularly elevated in immune cell clusters 2 and 22. Labeled cell types are
described in the original published study. (E) Average expression of the core clock gene set in the three identified cancer cell types. Cells lacking detectable
expression were excluded. (F) Average expression of the core clock gene set in all malignant cells and in all immune (non-malignant) cells. Results and
cluster plots were accessed through UCSC Cell Viewer.
through UCSC Cell Viewer (Figure 5A). Like the pairwise shown in Figure 5C. Like RORA and RORB in the pHGG
comparisons within the bulk MB tumor analyses, the 12 scRNA-seq results, the average expression of RORA was
circadian clock genes were more highly expressed overall in among the highest of the clock genes in MB cells (Figure 5B).
the Group 3 and Group 4 subtypes (Figure 5B), which were
both significantly higher than the SSH and WNT subtypes The percentage of cells in the four MB subtypes that
(Kruskal–Wallis Test, H = 30.834, p<0.001, n = 12, 3 df) as had detectable expression of the clock genes varied widely,
Volume 4 Issue 2 (2025) 9 doi: 10.36922/gpd.4112