Page 118 - GPD-4-2
P. 118

Gene & Protein in Disease                                             Pediatric glioma circadian clock genes


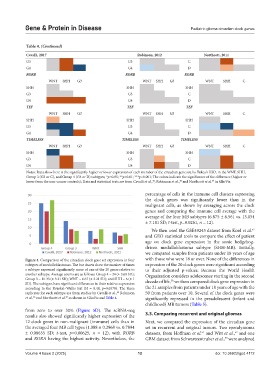
            Table 4. (Continued)
            Cavalli, 2017                                  Robinson, 2012               Northcott, 2011
            G3                                         G3                        C                
            G4                                         G4                        D                       
            RORB                                      RORB                     RORB
                      WNT   SHH   G3                          WNT  SHH   G3             WNT     SHH     C
            SHH                                        SHH                      SHH        
            G3                                         G3                        C                
            G4                                         G4                        D                       
            TEF                                        TEF                      TEF
                      WNT   SHH   G3                          WNT  SHH   G3             WNT     SHH     C
            SHH                                        SHH                      SHH        
            G3                                         G3                        C                
            G4                                         G4                        D                       
            TIMELESS                                 TIMELESS                 TIMELESS
                      WNT   SHH   G3                          WNT  SHH   G3             WNT     SHH     C
            SHH                                        SHH                      SHH        
            G3                                         G3                        C                
            G4                                         G4                        D                    
            Notes: Data show here is the significantly higher or lower expression of each member of the circadian gene set, by Tukey’s HSD, in the WNT, SHH,
            Group 3 (G3 or C), and Group 4 (G4 or D) subtypes; *p<0.05; **p<0.01; ***p<0.001; The colors indicate the significance of the difference (higher or
            lower from the non-cancer controls); Data and statistical tests are from Cavalli et al., ; Robinson et al.,  and Northcott et al.  in GlioVis.
                                                                             46
                                                                                           47
                                                                  45
                                                               percentage of cells in the immune cell clusters expressing
                                                               the clock genes was significantly lower than in the
                                                               malignant cells, as shown by averaging across the clock
                                                               genes and comparing the immune cell average with the
                                                               average of the four MB subtypes (6.875 ± 6.561 vs. 13.054
                                                               ± 7.181 SD; t-test, p=0.0261, n = 12).
                                                                 We then used the GSE49243 dataset from Kool et al.
                                                                                                            57
                                                               and GEO statistical tools to compare the effect of patient
                                                               age on clock gene expression in the sonic hedgehog-
                                                               driven medulloblastoma subtype (SHH-MB). Initially,
                                                               we compared samples from patients under 18 years of age
            Figure 4. Comparison of the circadian clock gene set expression in four   with those who were 18 or over. None of the differences in
            subtypes of medulloblastomas. The bar charts show the number of times   expression of the 20 clock genes were significant according
            a subtype expressed significantly more of one of the 20 genes relative to   to their adjusted p-values. Because the World Health
            another subtype. Average counts are as follows: Group 4 = 24 (± 3.60 SD);   Organization considers adolescence starting in the second
            Group 3 = 10.33 (± 3.21 SD); WNT = 6.67 (± 3.21 SD); and SHH = 6 (± 1   58
            SD). The subtypes have significant differences in their relative expression   decade of life,  we then compared clock gene expression in
            according to the Kruskal–Wallis test (H = 8.44,  p=0.0378). The three   the 21 samples from patients under 10 years of age with the
            replicates for each subtype are from studies by Cavalli et al.,  Robinson   50 from patients over 10. Several of the clock genes were
                                                   45
            et al.,  and Northcott et al.  as shown in GlioVis and Table 4.  significantly repressed in the preadolescent (infant and
                             47
               46
                                                               childhood) MB tumors (Table 5).
            from zero to over 30% (Figure  5D). The scRNA-seq
            results also showed significantly higher expression of the   3.3. Comparing recurrent and original gliomas
            12 clock genes in non-malignant (immune) cells than in   Next, we compared the expression of the circadian gene
            the averaged four MB cell types (1.088 ± 0.2968 vs. 0.7894   set in recurrent and original tumors. Two ependymoma
            ± 0.08655 SD;  t-test,  p=0.00625,  n = 12), with  RORB   datasets, from Hoffman et al.  and Witt et al.,  and one
                                                                                                     52
                                                                                       51
            and RORA having the highest activity. Nevertheless, the   GBM dataset from Schwartzentruber et al.,  were analyzed
                                                                                                 53
            Volume 4 Issue 2 (2025)                         12                               doi: 10.36922/gpd.4112
   113   114   115   116   117   118   119   120   121   122   123