
Page 113 - GPD-4-2
P. 113
Gene & Protein in Disease Pediatric glioma circadian clock genes
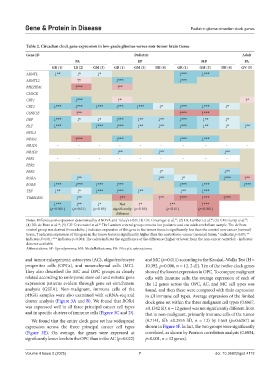
Table 2. Circadian clock gene expression in low‑grade gliomas versus non‑tumor brain tissue
Gene ID Pediatric Adult
PA EP MB PA
GR (1) LB (2) GM (3) GR (1) GM (3) DB (4) GR (1) GM (3) DB (4) GV (5)
ARNTL ↓** ↓* ↓* ↓*** ↓***
ARNTL2 ↑* ↓*** ↓***
BHLHE41 ↑*** ↑**
CLOCK
CRY1 ↓*** ↑* ↑*
CRY2 ↓*** ↓*** ↓*** ↓*** ↓*** ↓* ↓*** ↓*** ↓*
CSNK1E ↑** ↑*** ↑***
DBP ↓*** ↓* ↓* ↓*** ↓** ↓** ↓*** ↓** ↓*
HLF ↓*** ↓*** ↓*** ↓** ↓** ↓*** ↓** ↓* ↓**
NFIL3
NPAS2 ↑*** ↓*** ↓*** ↓***
NR1D1 ‑ ‑ ‑ ‑ ‑ ‑ ‑ ‑ ‑ ‑
NR1D2 ↓** ↓** ↓**
PER1 ‑ ‑ ‑ ‑ ‑ ‑ ‑ ‑ ‑
PER2
PER3 ↓* ↓**
RORA ↓** ↓** ↓* ↓*** ↑**
RORB ↓*** ↓*** ↓*** ↓*** ↓*** ↓*** ↓***
TEF ↓** ↓* ↓*** ↓*** ↓** ↓** ↓***
TIMELESS ↓** ↑** ↑** ↑*** ↑*** ↑***
↓*** ↓** ↓* Not ↑* ↑** ↑***
(p<0.001) (p<0.01) (p<0.05) significantly (p<0.05) (p<0.01) (p<0.001)
different
Notes: Differences in expression determined by ANOVA and Tukey’s HSD. (1) GR: Griesinger et al. ; (2) LB: Lambert et al. ; (3) GM: Gump et al. ;
30
37
38
(4) DB: de Bont et al. ; (5) GV: Gravendeel et al. The Lambert control group contains five pediatric and one adult cerebellum sample. The de Bont
41
54
control group was derived from adults; ↓ indicates expression of this gene in the tumor tissue is significantly less than the control non-cancer (normal)
tissue; ↑ indicates expression of this gene in the tumor tissue is significantly higher than the control non-cancer (normal) tissue; * indicates p<0.05; **
indicates P<0.01; *** indicates p<0.001; The colors indicate the significance of the difference (higher or lower from the non-cancer controls); - indicates
data not available.
Abbreviations: EP: Ependymoma; MB: Medulloblastoma; PA: Pilocytic astrocytoma.
and tumor enlargement: astrocytes (AC), oligodendrocyte and MC (p=0.011) according to the Kruskal–Wallis Test (H =
progenitor cells (OPCs), and mesenchymal cells (MC). 10.392, p=0.006, n = 12, 2 df). Ten of the twelve clock genes
They also described the MC and OPC groups as closely showed the lowest expression in OPC. To compare malignant
related according to embryonic stem cell and mitotic gene cells with immune cells, the average expression of each of
expression patterns evident through gene set enrichment the 12 genes across the OPC, AC, and MC cell types was
analysis (GSEA). Non-malignant, immune cells of the found, and then these were compared with their expression
pHGG samples were also examined with scRNA-seq and in all immune cell types. Average expression of the limited
cluster analysis (Figure 3A and B). We found that RORA clock gene set within the three malignant cell types (0.6867,
was expressed well in all three principal cancer cell types ±0.1342 SD, n = 12 genes) was not significantly different from
and in specific clusters of immune cells (Figure 3C and D). that in non-malignant, primarily immune cells of the tumor
We found that the entire clock gene set has widespread (0.7141, SD: ±0.2555 SD, n = 12) by t-test (p=0.6267) as
expression across the three principal cancer cell types shown in Figure 3F. In fact, the two groups were significantly
(Figure 3E). On average, the genes were expressed at correlated, as shown by Pearson correlation analysis (0.6854,
significantly lower levels in the OPC than in the AC (p=0.022) p<0.001, n = 12 genes).
Volume 4 Issue 2 (2025) 7 doi: 10.36922/gpd.4112