
Page 112 - GPD-4-2
P. 112
Gene & Protein in Disease Pediatric glioma circadian clock genes
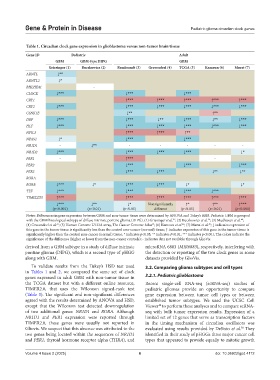
Table 1. Circadian clock gene expression in glioblastoma versus non‑tumor brain tissue
Gene ID Pediatric Adult
GBM GBM‑type DIPG GBM
Griesinger (1) Buczkowicz (2) Rembrandt (3) Gravendeel (4) TCGA (5) Kamoun (6) Murat (7)
ARNTL ↓**
ARNTL2 ↓*
BHLHE41 ‑
CLOCK ↓*** ↓*** ↓***
CRY1 ↑*** ↑*** ↑*** ↑*** ↑***
CRY2 ↓*** ↓*** ↓*** ↓*** ↓*** ↓***
CSNK1E ↓** ↑**
DBP ↓*** ↓*** ↓** ↓*** ↓** ↓***
HLF ↓*** ↓*** ↓*** ↓*** ↓*** ↓***
NFIL3 ↑*** ↑*** ↑**
NPAS2 ↓* ↓*** ↓***
NR1D1 ‑ ↓** ‑ ‑ ‑ ‑ ‑
NR1D2 ↓*** ↓*** ↓*** ↓*** ↓*
PER1 ‑ ↑*** ‑
PER2 ↓*** ↓*** ↓***
PER3 ↓*** ↓*** ↓** ↓**
RORA
RORB ↓*** ↓* ↓*** ↓*** ↓* ↓*
TEF ↓*** ↓*** ↓*** ↓***
TIMELESS ↑*** ↑*** ↑*** ↑*** ↑*** ↑***
↓*** ↓** ↓* Not significantly ↑* ↑** ↑***
(p<0.001) (p<0.01) (p<0.05) different (p<0.05) (p<0.01) (p<0.001)
Notes: Differences in gene expression between GBM and non-tumor tissue were determined by ANOVA and Tukey’s HSD. Pediatric GBM is grouped
with the GBM histological subtype of diffuse intrinsic pontine glioma (DIPG). (1) Griesingeret al. ; (2) Buczkowicz et al. ; (3) Madhavan et al. ;
36
40
37
(4) Gravendeel et al. ; (5) Human Genome U133A array, The Cancer Genome Atlas ; (6) Kamoun et al. ; (7) Murat et al. ; ↓ indicates expression of
42
43
41
39
this gene in the tumor tissue is significantly less than the control non-cancer (normal) tissue; ↑ indicates expression of this gene in the tumor tissue is
significantly higher than the control non-cancer (normal) tissue; * indicates p<0.05; ** indicates P<0.01; *** indicates p<0.001; The colors indicate the
significance of the difference (higher or lower from the non-cancer controls); - indicates data not available through GlioVis.
derived from a GBM subtype in a study of diffuse intrinsic microRNA 6883 (MIR6883), respectively, interfering with
pontine glioma (DIPG), which is a second type of pHGG the detection or reporting of the two clock genes in some
along with GBM. datasets provided by GlioVis.
To validate results from the Tukey’s HSD test used 3.2. Comparing glioma subtypes and cell types
in Tables 1 and 2, we compared the same set of clock
genes expressed in adult GBM with non-tumor tissue in 3.2.1. Pediatric glioblastoma
the TCGA dataset but with a different online resource, Recent single-cell RNA-seq (scRNA-seq) studies of
TIMER2.0, that uses the Wilcoxon signed-rank test pediatric gliomas provide an opportunity to compare
(Table 3). The significant and non-significant differences gene expression between tumor cell types or between
agreed with the results determined by ANOVA and HSD, established tumor subtypes. We used the UCSC Cell
except that the Wilcoxon test detected downregulation Viewer to perform these analyses and to compare scRNA-
48
of two additional genes: NR1D1 and RORA. Although seq with bulk tumor expression results. Expression of a
NR1D1 and PER1 expression were reported through limited set of 12 genes that serve as transcription factors
TIMER2.0, these genes were usually not reported in in the timing mechanism of circadian oscillators was
Gliovis. We suspect that this absence was attributed to the evaluated using results provided by DeSisto et al. They
50
two genes being located within the sequences of NR1D1 identified in their study of pHGGs three major cancer cell
and PER1, thyroid hormone receptor alpha (THRA), and types that appeared to provide equally to mitotic growth
Volume 4 Issue 2 (2025) 6 doi: 10.36922/gpd.4112