
Page 114 - GPD-4-2
P. 114
Gene & Protein in Disease Pediatric glioma circadian clock genes
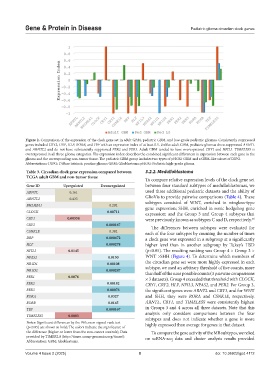
Figure 2. Comparison of the expression of the clock gene set in adult GBM, pediatric GBM, and low-grade pediatric gliomas. Consistently suppressed
genes included CRY2, DBP, HLF, RORB, and TEF with an expression index of at least 0.5. Unlike adult GBM, pediatric gliomas show suppressed ARNTL
and ARNTL2 and do not have substantially suppressed PER2 and PER3. Adult GBM tended to have overexpressed CRY1 and NFIL3. TIMELESS is
overexpressed in all three glioma categories. The expression index describes the combined significant differences in expression between each gene in the
glioma and the corresponding non-tumor tissue. The pediatric GBM group includes two types of pHGG: GBM and a GBM-like subset of DIPG.
Abbreviations: DIPG: Diffuse intrinsic pontine glioma; GBM: Glioblastoma; pHGG: Pediatric high-grade glioma.
Table 3. Circadian clock gene expression compared between 3.2.2. Medulloblastoma
TCGA adult GBM and non‑tumor tissue
To compare relative expression levels of the clock gene set
Gene ID Upregulated Downregulated between four standard subtypes of medulloblastomas, we
ARNTL 0.161 used three additional pediatric datasets and the ability of
ARNTL2 0.433 GlioVis to provide pairwise comparisons (Table 4). These
BHLHE41 0.292 subtypes consisted of WNT, enriched in wingless-type
gene expression; SHH, enriched in sonic hedgehog gene
CLOCK 0.00711 expression; and the Group 3 and Group 4 subtypes that
CRY1 0.00558 were previously known as subtypes C and D, respectively. 56
CRY2 0.000167 The differences between subtypes were evaluated for
CSNK1E 0.382
each of the four subtypes by counting the number of times
DBP 0.000472 a clock gene was expressed in a subgroup at a significantly
HLF 0.000278 higher level than in another subgroup by Tukey’s HSD
NFIL3 0.0145 (p<0.05). The resulting ranking was Group 4 > Group 3 >
NPAS2 0.0150 WNT >SHH (Figure 4). To determine which members of
NR1D1 0.00108 the circadian gene set were more highly expressed in each
NR1D2 0.000247 subtype, we used an arbitrary threshold of five counts, more
than half of the nine possible counts (3 pairwise comparisons
PER1 0.0876 × 3 datasets). Group 4 exceeded that threshold with CLOCK,
PER2 0.00182 CRY1, CRY2, HLF, NFIL3, NPAS2, and PER2. For Group 3,
PER3 0.00076 the significant genes were ARNTL and CRY1, and for WNT
RORA 0.0327 and SHH, they were RORA and CSNK1E, respectively.
RORB 0.0145 ARNTL, CRY1, and TIMELESS were consistently highest
TEF 0.000167 in Groups 3 and 4 across all three datasets. Note that this
TIMELESS 0.0003 analysis only considers comparisons between the four
subtypes and does not indicate whether a gene is more
Notes: Significant differences by the Wilcoxon signed-rank test highly expressed than average for genes in that dataset.
(p<0.05) are shown in bold; The colors indicate the significance of
the difference (higher or lower from the non-cancer controls); Data To compare the gene activity of the MB subtypes, we relied
provided by TIMER2.0 (http://timer. comp-genomics.org/timer/). on scRNA-seq data and cluster analysis results provided
Abbreviation: GBM: Glioblastoma.
Volume 4 Issue 2 (2025) 8 doi: 10.36922/gpd.4112