
Page 84 - GTM-2-1
P. 84
Global Translational Medicine Telomere length, mtDNA copy number and colorectal cancer
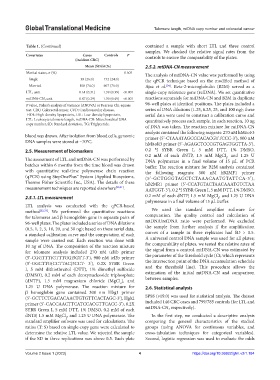
Table 1. (Continued) contained a sample with short LTL and three control
samples. We checked the relative signal rates from the
Covariates Cases Controls P controls to ensure the comparability of the plates.
(incident CRC)
Mean (SD)/n(%) 2.5.2. mtDNA-CN measurement
Marital status, n (%) 0.605 The analysis of mtDNA-CN value was performed by using
Single 38 (26.0) 152 (24.0) the qPCR technique based on the modified method of
Married 108 (74.0) 607 (76.0) Ajaz et al. . Beta-2-microglobulin (B2M) served as a
[34]
LTL, unit 0.61 (0.31) 1.39 (0.39) <0.001 single-copy reference gene (refDNA). We set quantitative
mtDNA-CN, unit 0.87 (0.29) 1.30 (0.49) <0.001 reactions separately for mtDNA-CN and B2M in duplicate
P value, Fisher’s analysis of variance (ANOVA) or Pearson Chi-square 96-well plates at identical positions. The plates included a
test. CRC: Colorectal cancer, CVD: Cardiovascular disease, series of DNA dilutions (1.25, 6.25, 25, and 100 ng); these
HDL: High-density lipoprotein, LDL: Low-density lipoprotein, serial data were used to construct a calibration curve and
LTL: Leukocyte telomere length, mtDNA-CN: Mitochondrial DNA quantitatively process each sample. In each reaction, 10 ng
copy number, SD: Standard deviation, TG: Triglyceride.
of DNA was taken. The reaction mixture for mtDNA-CN
analysis contained the following reagents: 270 nM hMitoF3
blood was drawn. After isolation from blood cells, genomic primer (5’-CTAAATAGCCCACACGTTCCC-3’), 900 nM
DNA samples were stored at −70°C. hMitoR3 primer (5’-AGAGCTCCCGTGAGTGGTTA-3’),
2.5. Measurement of biomarkers 0.2 Ч SYBR Green I, 5 mM DTT, 1% DMSO,
0.2 mM of each dNTP, 1.5 mM MgCl , and 1.25 U
2
The assessment of LTL and mtDNA-CN was performed by DNA polymerase in a final volume of 15 μL of PCR
batches within 6 months from the time blood was drawn buffer. The reaction mixture for B2M analysis contained
with quantitative real-time polymerase chain reaction the following reagents: 300 nM hB2MF1 primer
(qPCR) using StepOnePlus™ System (Applied Biosystems, (5’-GCTGGGTAGCTCTAAACAATGTATTCA-3’),
Thermo Fisher Scientific Inc., USA). The details of these hB2MR1 primer (5’-CCATGTACTAACAAATGTCTAA
measurement techniques are reported elsewhere [30,31] . AATGGT-3’), 0.2 Ч SYBR Green I, 5 mM DTT, 1% DMSO,
2.5.1. LTL measurement 0.2 mM of each dNTP, 1.5 mM MgCl , and 1.25 U DNA
2
polymerase in a final volume of 15 μL buffer.
LTL analysis was conducted with the qPCR-based
method [32,33] . We performed the quantitative reactions We used the standard amplifier software for
for telomeres and β hemoglobin gene in separate pairs of computation. The quality control and calculation of
96-well plates. The plates included a series of DNA dilutions mtDNA/refDNA ratio were performed. We excluded
(0.5, 1, 2, 5, 10, 20, and 30 ng); based on these serial data, the sample from further analysis if the amplification
a standard calibration curve and the computation of each curves of a sample in three replicates had SD > 0.5.
sample were carried out. Each reaction was done with A universal control DNA sample was used for all plates;
10 ng of DNA. The composition of the reaction mixture for comparability of plates, we tested the relative rates of
for telomere analysis included 270 nM tel1b primer the signal from a control. mtDNA-CN was estimated by
(5’-CGGTTT(GTTTGG)5GTT-3’), 900 nM tel2b primer the parameter of the threshold cycle (Ct; which represents
(5’-GGCTTG(CCTTAC)5CCT- 3’), 0.2X SYBR Green the intersection point of the DNA accumulation schedule
I, 5 mM dithiothreitol (DTT), 1% dimethyl sulfoxide and the threshold line). This procedure allows the
(DMSO), 0.2 mM of each deoxynucleoside triphosphate estimation of the initial mtDNA-CN and comparison
(dNTP), 1.5 mM magnesium chloride (MgCl ), and between samples.
2
1.25 U DNA polymerase. The reaction mixture for 2.6. Statistical analysis
β hemoglobin gene contained 300 nm Hbg1 primer
(5’-GCTTCTGACACAACTGTGTTCACTAGC-3’), Hgb2 SPSS (v19.0) was used for statistical analysis. The dataset
primer (5’-CACCAACTTCATCCACGTTCACC-3’), 0.2X included 146 CRC cases and 799/785 controls (for LTL and
SYBR Green I, 5 mM DTT, 1% DMSO, 0.2 mM of each mtDNA-CN, respectively).
dNTP, 1.5 mM MgCl , and 1.25 U DNA polymerase. The In the first step, we conducted a descriptive analysis
2
standard amplifier software was used for calculations. The comparing the general characteristics of the studied
ratios (T: S) based on single-copy gene were calculated to groups (using ANOVA for continuous variables, and
determine the relative LTL value. We rejected the sample cross-tabulation techniques for categorical variables).
if the SD in three replications was above 0.5. Each plate Second, logistic regression was used to evaluate the odds
Volume 2 Issue 1 (2023) 4 https://doi.org/10.36922/gtm.v2i1.184