
Page 83 - GTM-2-1
P. 83
Global Translational Medicine Telomere length, mtDNA copy number and colorectal cancer
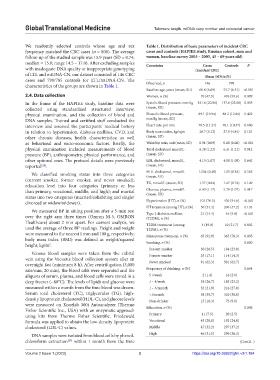
We randomly selected controls whose age and sex Table 1. Distribution of basic parameters of incident CRC
frequency matched the CRC cases (n = 806). The average cases and controls (HAPIEE study, Russian cohort, men and
follow-up of the studied sample was 15.9 years (SD = 0.74; women, baseline survey 2003 – 2005, 45 – 69 years old)
median = 15.9; range 14.5 – 17.0). After excluding samples Covariates Cases Controls P
with inadequate DNA quality or inappropriate genotyping (incident CRC)
of LTL and mtDNA-CN, our dataset consisted of 146 CRC Mean (SD)/n(%)
cases and 799/785 controls for LTL/mtDNA-CN. The Observed, n 146 799
characteristics of the groups are shown in Table 1.
Baseline age, years (mean, SD) 60.8 (6.69) 55.7 (6.51) <0.001
2.4. Data collection Women, n (%) 70 (47.9) 476 (59.6) 0.009
In the frame of the HAPIEE study, baseline data were Systolic blood pressure, mmHg 141.8 (20.86) 137.6 (22.58) 0.035
collected using standardized structured interview, (mean, SD)
physical examination, and the collection of blood and Diastolic blood pressure, 89.1 (10.94) 88.2 (12.86) 0.422
DNA samples. Trained and certified stuff conducted the mmHg (mean, SD)
interview and assessed the participants’ medical history Heart rate, per min 70.5 (11.27) 70.1 (10.37) 0.680
in relation to hypertension, diabetes mellitus, CVD, and Body mass index, kg/sqm 28.7 (5.12) 27.9 (4.84) 0.101
other chronic diseases; health characteristics; as well (mean, SD)
as behavioral and socio-economic factors. Briefly, the Waist/hip ratio, unit (mean, SD) 0.91 (0.09) 0.88 (0.08) <0.001
physical examination included measurements of blood Total cholesterol mmol/L 6.38 (1.23) 6.31 (1.21) 0.512
pressure (BP), anthropometry, physical performance, and (mean, SD)
other optional ones. The protocol details were previously LDL cholesterol, mmol/L 4.13 (1.07) 4.08 (1.08) 0.642
[28]
reported . (mean, SD)
HDL cholesterol, mmol/L 1.534 (0.40) 1.55 (0.34) 0.565
We classified smoking status into three categories (mean, SD)
(current smoker, former smoker, and never smoked); TG, mmol/L (mean, SD) 1.57 (0.84) 1.47 (0.74) 0.149
education level into four categories (primary or less
than primary, vocational, middle, and high); and marital Glucose, plasma, mmol/L 6.03 (1.17) 5.79 (1.07) 0.017
(mean, SD)
status into two categories (married/cohabiting and single/
divorced or widow/widower). Hypertension (HT), n (%) 103 (70.5) 436 (54.6) <0.001
HT treatment (among HT), n (%) 56 (54.4) 206 (47.2) 0.193
We measured BP in sitting position after a 5-min rest
over the right arm three times (Omron M-5, OMRON Type 2 diabetes mellitus 21 (14.4) 46 (5.8) <0.001
(T2DM), n (%)
Healthcare) about 2 min apart. For current analysis, we T2DM treatment (among 4 (19.0) 10 (21.7) 0.802
used the average of three BP readings. Height and weight T2DM), n (%)
were measured to the nearest 1 mm and 100 g, respectively; Menopause (women), n (%) 65 (92.9) 363 (76.3) 0.005
body mass index (BMI) was defined as weight/squared
2
height, kg/m . Smoking, n (%) 0.600
Present smoker 30 (20.5) 184 (23.0)
Venous blood samples were taken from the cubital Former smoker 25 (17.1) 114 (14.3)
vein using the Vacuette blood collection system after an
overnight fast (minimum 8 h). After centrifugation (3,000 Never smoked 91 (62.3) 501 (62.7)
rate/min, 20 min), the blood cells were separated and the Frequency of drinking, n (%) 0.664
aliquots of serum, plasma, and blood cells were stored in a 5+/week 2 (1.4) 16 (2.0)
deep freezer (−80°C). The levels of lipids and glucose were 1 – 4/week 39 (26.7) 185 (23.2)
measured within a month from the time blood was drawn. 1 – 3/month 32 (21.9) 216 (27.0)
Serum total cholesterol (TC), triglycerides (TG), high- <1/month 58 (39.7) 310 (38.8)
density lipoprotein cholesterol (HDL-C), and glucose levels Non-drinker 15 (10.3) 72 (9.0)
were measured on Konelab 300i Autoanalyzer (Thermo Education, n (%) 0.006
Fisher Scientific Inc., USA) with an enzymatic approach
using kits from Thermo Fisher Scientific. Friedewald Primary 11 (7.5) 20 (2.5)
formula was applied to obtain the low-density lipoprotein Vocational 43 (28.8) 192 (24.0)
cholesterol (LDL-C) values. Middle 47 (32.2) 297 (37.2)
DNA samples were isolated from blood cells by phenol- High 46 (31.5) 290 (36.3)
chloroform extraction within 1 month from the time (Cont’d...)
[29]
Volume 2 Issue 1 (2023) 3 https://doi.org/10.36922/gtm.v2i1.184