
Page 87 - GTM-2-1
P. 87
Global Translational Medicine Telomere length, mtDNA copy number and colorectal cancer
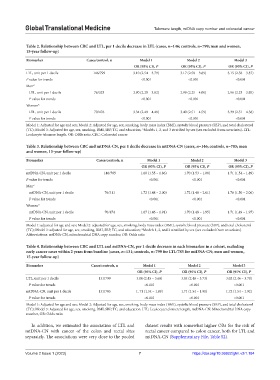
Table 2. Relationship between CRC and LTL, per 1 decile decrease in LTL (cases, n=146; controls, n=799; men and women,
15‑year follow‑up)
Biomarker Cases/control, n Model 1 Model 2 Model 3
OR (95% CI), P OR (95% CI), P OR (95% CI), P
LTL, unit per 1 decile 146/799 3.10 (2.54 – 3.79) 3.17 (2.58 – 3.89) 3.15 (2.56 – 3.87)
P value for trends <0.001 <0.001 <0.001
Men*
LTL, unit per 1 decile 76/323 2.90 (2.20 – 3.82) 2.99 (2.25 – 4.00) 2.96 (2.23 – 3.95)
P value for trends <0.001 <0.001 <0.001
Women*
LTL, unit per 1 decile 70/476 3.34 (2.49 – 4.48) 3.40 (2.51 – 4.59) 3.39 (2.51 – 4.58)
P value for trends <0.001 <0.001 <0.001
Model 1: Adjusted for age and sex; Model 2: Adjusted for age, sex, smoking, body mass index (BMI), systolic blood pressure (SBP), and total cholesterol
(TC); Model 3: Adjusted for age, sex, smoking, BMI, SBP, TC, and education; *Models 1, 2, and 3 stratified by sex (sex excluded from covariates). LTL:
Leukocyte telomere length, OR: Odds ratio, CRC: Colorectal cancer
Table 3. Relationship between CRC and mtDNA‑CN, per 1 decile decrease in mtDNA‑CN (cases, n=146; controls, n=785; men
and women, 15‑year follow‑up)
Biomarker Cases/controls, n Model 1 Model 2 Model 3
OR (95% CI), P OR (95% CI), P OR (95% CI), P
mtDNA-CN, unit per 1 decile 146/785 1.68 (1.55 – 1.86) 1.70 (1.53 – 1.88) 1.71 (1.54 – 1.89)
P value for trends <0.001 <0.001 <0.001
Men*
mtDNA-CN, unit per 1 decile 76/311 1.72 (1.48 – 2.00) 1.72 (1.48 – 2.01) 1.76 (1.50 – 2.06)
P value for trends <0.001 <0.001 <0.001
Women*
mtDNA-CN, unit per 1 decile 70/474 1.67 (1.46 – 1.91) 1.70 (1.48 – 1.95) 1.71 (1.49 – 1.97)
P value for trends <0.001 <0.001 <0.001
Model 1: adjusted for age and sex; Model 2: adjusted for age, sex, smoking, body mass index (BMI), systolic blood pressure (SBP), and total cholesterol
(TC); Model 3: adjusted for age, sex, smoking, BMI, SBP, TC, and education; *Models 1, 2, and 3 stratified by sex (sex excluded from covariates).
Abbreviations: mtDNA-CN, mitochondrial DNA copy number, OR: Odds ratio
Table 4. Relationship between CRC and LTL and mtDNA‑CN, per 1 decile decrease in each biomarker in a cohort, excluding
early cancer cases within 2 years from baseline (cases, n=131; controls, n=799 for LTL/785 for mtDNA‑CN; men and women,
15‑year follow‑up)
Biomarker Cases/controls, n Model 1 Model 2 Model 3
OR (95% CI), P OR (95% CI), P OR (95% CI), P
LTL, unit per 1 decile 131/799 3.00 (2.45 – 3.66) 3.04 (2.48 – 3.73) 3.02 (2.46 – 3.70)
P value for trends <0.001 <0.001 <0.001
mtDNA-CN, unit per 1 decile 131/785 1. 71 (1.54 – 1.89) 1.71 (1.54 – 1.91) 1.72 (1.54 – 1.92)
P value for trends <0.001 <0.001 <0.001
Model 1: Adjusted for age and sex; Model 2: Adjusted for age, sex, smoking, body mass index (BMI), systolic blood pressure (SBP), and total cholesterol
(TC); Model 3: Adjusted for age, sex, smoking, BMI, SBP, TC, and education. LTL: Leukocyte telomere length, mtDNA-CN: Mitochondrial DNA copy
number, OR: Odds ratio
In addition, we estimated the association of LTL and dataset results with somewhat higher ORs for the risk of
mtDNA-CN with cancer of the colon and rectal sites rectal cancer compared to colon cancer, both for LTL and
separately. The associations were very close to the pooled mtDNA-CN (Supplementary File, Table S2).
Volume 2 Issue 1 (2023) 7 https://doi.org/10.36922/gtm.v2i1.184