
Page 86 - GTM-2-1
P. 86
Global Translational Medicine Telomere length, mtDNA copy number and colorectal cancer
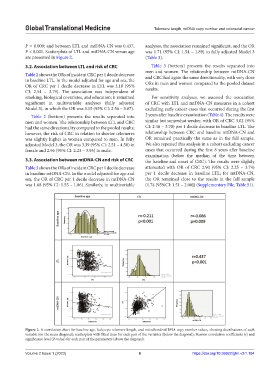
P = 0.009; and between LTL and mtDNA-CN was 0.437, analyses, the association remained significant, and the OR
P < 0.001. Scatterplots of LTL and mtDNA-CN versus age was 1.71 (95% CI: 1.54 – 1.89) in fully adjusted Model 3
are presented in Figure 2. (Table 3).
3.2. Association between LTL and risk of CRC Table 3 (bottom) presents the results separated into
men and women. The relationship between mtDNA-CN
Table 2 shows the ORs of incident CRC per 1 decile decrease and CRC had again the same directionality, with very close
in baseline LTL. In the model adjusted for age and sex, the ORs in men and women compared to the pooled dataset
OR of CRC per 1 decile decrease in LTL was 3.10 (95%
CI: 2.54 – 3.79). The association was independent of results.
smoking, biological covariates, and education; it remained For sensitivity analyses, we assessed the association
significant in multivariable analyses (fully adjusted of CRC with LTL and mtDNA-CN measures in a cohort
Model 3), in which the OR was 3.15 (95% CI: 2.56 – 3.87). excluding early cancer cases that occurred during the first
Table 2 (bottom) presents the results separated into 2 years after baseline examination (Table 4). The results were
men and women. The relationship between LTL and CRC similar but somewhat weaker, with OR of CRC 3.02 (95%
had the same directionality compared to the pooled results; CI: 2.46 – 3.70) per 1 decile decrease in baseline LTL. The
however, the risk of CRC in relation to shorter telomeres relationship between CRC and baseline mtDNA-CN and
was slightly higher in women compared to men. In fully OR remained practically the same as in the full sample.
adjusted Model 3, the OR was 3.39 (95% CI: 2.51 – 4.58) in We also repeated this analysis in a cohort excluding cancer
female and 2.96 (95% CI: 2.23 – 3.95) in male. cases that occurred during the first 8 years after baseline
examination (below the median of the time between
3.3. Association between mtDNA-CN and risk of CRC the baseline and onset of CRC). The results were slightly
Table 3 shows the ORs of incident CRC per 1 decile decrease attenuated with OR of CRC 2.90 (95% CI: 2.25 – 3.74)
in baseline mtDNA-CN. In the model adjusted for age and per 1 decile decrease in baseline LTL; for mtDNA-CN,
sex, the OR of CRC per 1 decile decrease in mtDNA-CN the OR remained close to the results in the full sample
was 1.68 (95% CI: 1.55 – 1.86). Similarly, in multivariable (1.74 [95%CI: 1.51 – 2.00]) (Supplementary File, Table S1).
Figure 2. A correlation chart for baseline age, leukocyte telomere length, and mitochondrial DNA copy number values, showing distributions of each
variable (on the main diagonal); scatterplots with fitted lines for each pair of the variables (below the diagonal); Pearson correlation coefficients (r) and
significance level (P-value) for each pair of the parameters (above the diagonal).
Volume 2 Issue 1 (2023) 6 https://doi.org/10.36922/gtm.v2i1.184