
Page 62 - GTM-3-1
P. 62
Global Translational Medicine Reproductive hormones and muscle in obesity
Table 2. Biochemical and hormonal parameters of serum of the experimental animals
Index Male rats Female rats
Control (n = 13) HCD (n = 14) Control (n = 14) HCD (n = 13)
Total bilirubin (μmol/l) 1.40 (1.20; 1.60) 2.40 (1.60; 3.00)** 2.30 (2.10; 2.90) 3.60 (2.40; 4.20) #
Aspartate aminotransferase (U/l) 196.00 (181.00; 217.00) 172.00 (146.00; 189.00)* 162.00 (144.00; 185.00) 159.00 (129.00; 164.00)
Alanine aminotransferase (U/l) 65.00 (62.00; 74.00) 57.50 (51.00; 68.00) 54.00 (43.00; 67.00) 36.00 (33.00; 41.00) ##
Alkaline phosphatase (U/l) 373.00 (333.00; 423.00) 674.50 (371.00; 850.00)** 276.50 (219.00; 392.00) 496.00 (365.00; 661.00) ###
Urea (mmol/l) 6.83 (6.45; 8.40) 4.35 (3.45; 4.77)**** 6.35 (5.83; 6.73) 3.66 (3.37; 4.21) ####
Glucose (mmol/l) 5.81 (5.61; 7.37) 7.54 (7.10; 8.21)** 6.88 (6.07; 7.21) 7.80 (7.24; 8.03) #
Alpha amylase (U/l) 1508 (1426; 1712) 1940 (1788; 2124)*** 1556 (1418; 1748) 1758 (1580; 1860) #
Cholesterol (mmol/l) 1.43 (1.23; 1.61) 1.88 (1.50; 1.95)** 1.62 (1.47; 1.77) 1.67 (1.36; 1.90)
Triglycerides (mmol/l) 0.88 (0.63; 1.18) 1.18 (0.94; 2.21)* 1.37 (0.84; 1.80) 0.96 (0.66; 2.47)
Estradiol (nmol/l) 0.65 (0.50; 0.76) 0.43 (0.19; 0.62)* 0.39 (0.35; 0.43) 0.41 (0.39; 0.45)
Testosterone (nmol/l) 7.78 (5.35; 24.70) 2.73 (2.11; 5.22)* 0.01 (0.00; 0.28) 0.62 (0.10; 1.36) #
Testosterone/estradiol ratio 12.61 (8.44; 31.95) 7.30 (4.03; 23.25) 0.03 (0.03; 0.64) 1.46 (0.18; 4.61) #
Luteinizing hormone (IU/l) 0.30 (0.09; 0.73) 0.70 (0.27; 4.15) 0.81 (0.17; 2.08) 0.55 (0.40; 1.06)
Corticosterone (nmol/l) 727.60 (489.70; 1013.80) 817.20 (565.50; 1027.60) 655.10 (264.20; 741.30) 1020.30 (898.50; 1050.70) #
th
th
Note: Data are presented as median (25 percentile; 75 percentile); statistically significant differences between the male HCD and male control groups
at *P < 0.05, **P < 0.01, ***P < 0.001, and ****P < 0.0001; statistically significant differences between the female HCD and female control groups at
###
##
# P < 0.05, P < 0.01, P < 0.001, and #### P < 0.0001.
Abbreviation: HCD: High-calorie diet.
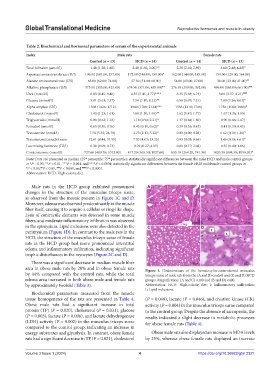
Male rats in the HCD group exhibited pronounced A B
changes in the structure of the musculus triceps surae,
as observed from the mosaic pattern in Figure 1C and D.
Moreover, edema was observed predominantly in the muscle
fiber itself, causing it to acquire a cellular or ring-like shape.
Lysis of contractile elements was detected in some muscle
fibers, and moderate inflammatory infiltration was observed
in the epimysium. Lipid inclusions were also detected in the C D
perimysium (Figure 1D). In contrast to the male rats in the
HCD, the structure of the musculus triceps surae of female
rats in the HCD group had more pronounced interstitial
edema and inflammatory infiltration, indicating significant
trophic disturbances in the myocytes (Figure 2C and D).
There was a significant decrease in median muscle fiber
area in obese male rats by 20% and in obese female rats Figure 1. Histostructure of the hematoxylin-eosin-stained musculus
by 44% compared with the control rats, while the total triceps surae of male rats from the (A and B) control and (C and D) HCD
edema area increased in both obese male and female rats groups. Magnification: (A and C) ×100 and (B and D) ×400.
by approximately twofold (Table 3). Abbreviation: HCD: High-calorie diet; I: Inflammatory infiltration;
L: Lipid inclusions.
Biochemical parameters measured from the muscle
tissue homogenates of the rats are presented in Table 4. (P = 0.048), lactate (P = 0.046), and creatine kinase (CK)
Obese male rats had a significant increase in total activity (P = 0.004) in the musculus triceps surae compared
protein (TP) (P = 0.020), cholesterol (P = 0.031), glucose to the control group. Despite the absence of sarcopenia, the
(P = 0.003), lactate (P = 0.006), and lactate dehydrogenase results indicated a slight decrease in metabolic processes
(LDH) activity (P = 0.002) in the musculus triceps surae for obese female rats (Table 4).
compared to the control group, indicating an increase in
energy substrates and glycolysis. In contrast, obese female Obese male rats also displayed an increase in MDA levels
rats had a significant decrease in TP (P = 0.021), cholesterol by 25%, whereas obese female rats displayed an increase
Volume 3 Issue 1 (2024) 4 https://doi.org/10.36922/gtm.2321